


NaviModel Producer
- Supplier:
- EIVA
- Product no :
- NS.NMPRO
- Cable, pipe and asset inspections
- UXO surveys
- AUV onboard processing and navigation
- Hydrography and geophysics
- USV- and vessel-based hydrographic inspections
- Harbour inspections
- Geophysical surveys
- Maritime constructions
- Dredging
- Cable lay
- Jack-up operations
- Ocean science and archeology
- Oceanography
- MetOcean
- Environmental studies
- Archeology
Key features and benefits

NaviModel in action with our customers
Featuring our customers’ own experiences with NaviModel in real-world settings, these case studies deliver valuable insights about how and where it can be adopted, deployed and utilised.
Check out how our customers use NaviModel for a wide variety of application, such as...
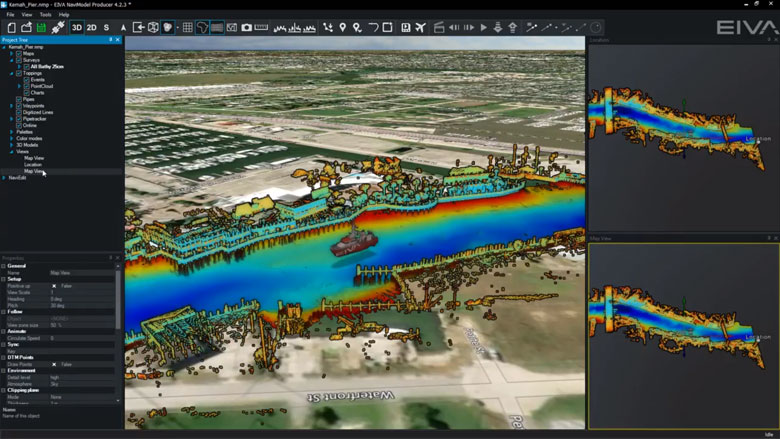
Harbour inspection
When performing harbour inspections, 'NaviModel is a modern, fantastic tool to work with’ according to Henrik Halvorsen, Styvehavn AS. ‘It can display many kinds of data in 3D and allows us to prepare and deliver state of the art survey data to our clients.'
Learn how Styvehavn used NaviModel for a harbour inspection
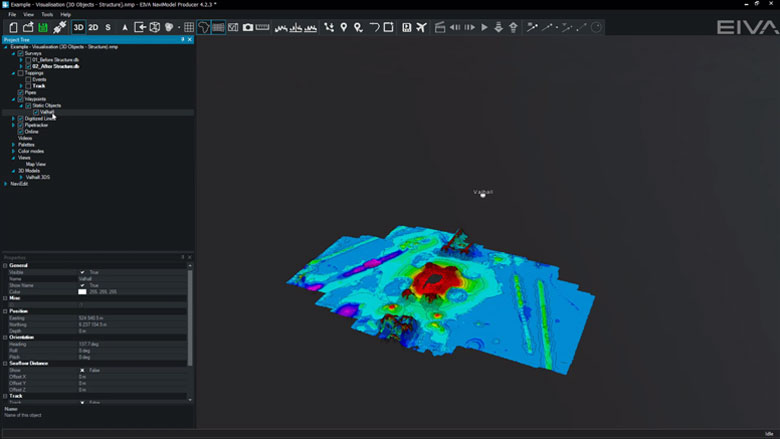
The Port of Moss visualised in NaviModel
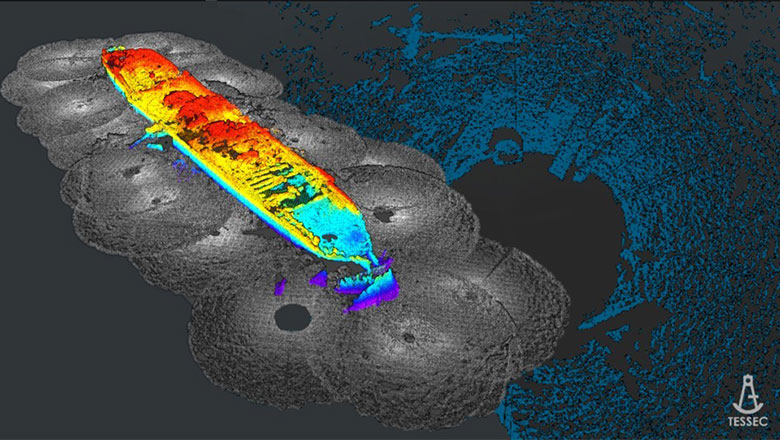
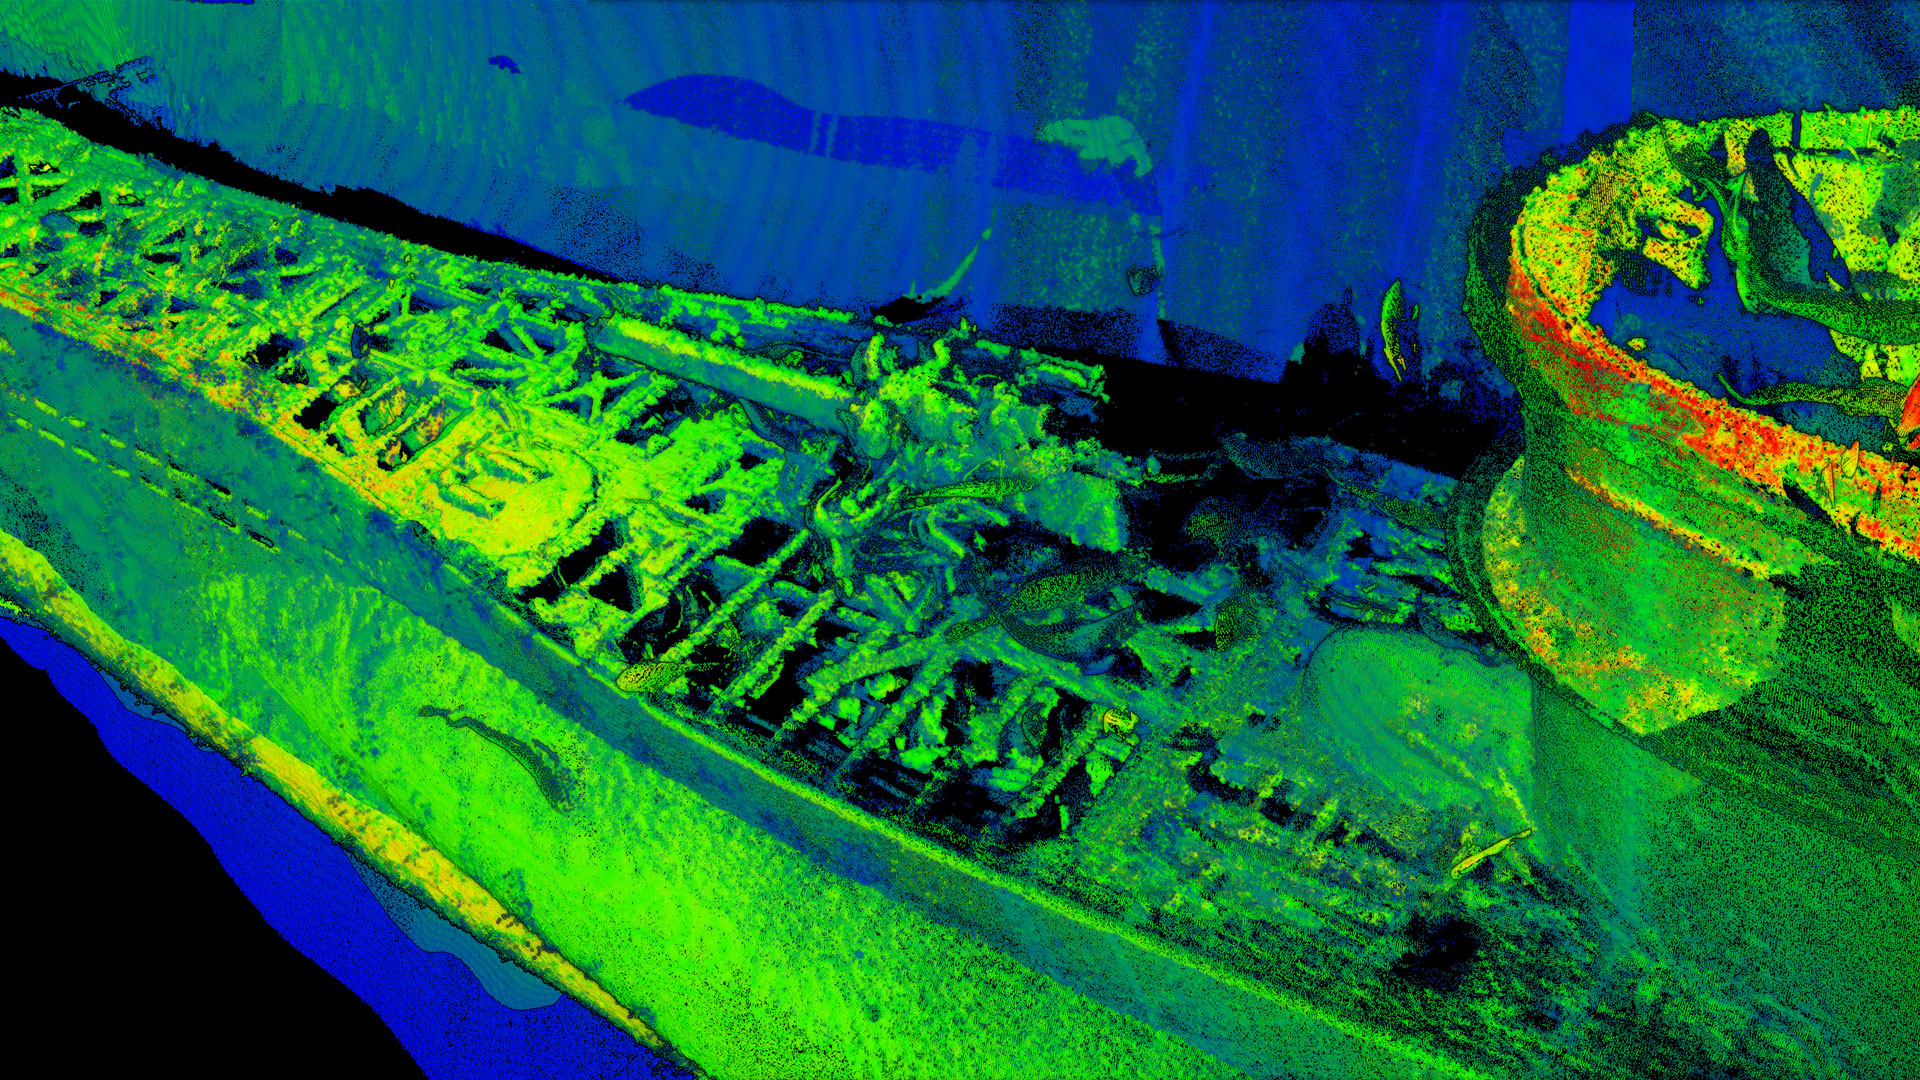
Shipwrecks
NaviModel is often used for modelling shipwrecks, due to its powerful 3D modelling and visualisation capabilities, as well as precise positioning.
Learn how NaviModel was used for studying WWII shipwrecks down to the millimetre
In a project using NaviSuite to pan and document a shipwreck removal, our software ‘provided tools that guaranteed a difficult process was made easy and intuitive, enabling fast analysis of data just a few hours after it was collected' said Technical Director Thomaz Tessler, TESSEC Engineering and Maritime Services.
Learn how NaviModel was used for planning and documenting a shipwreck removal
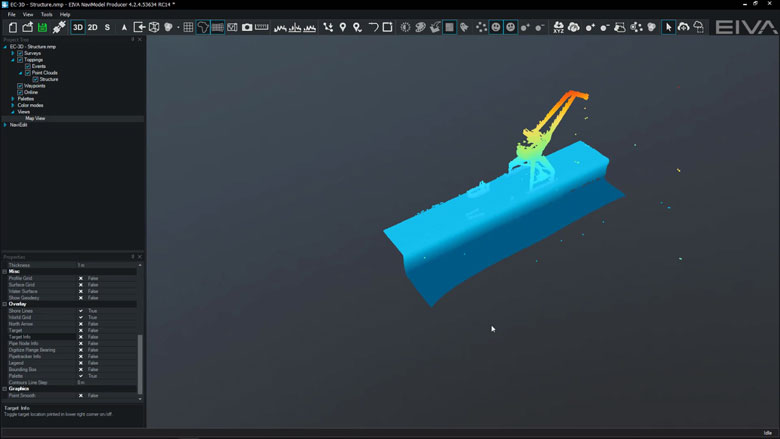
A 3D model of a wreck generated with NaviModel Producer software
Quality control (QC) toolbox
NaviModel can also be used for quality controlling data. The QC tools in NaviModel can quality control survey data (DTMs), geodetic networks (such as LBL arrays), tidal prediction, catenary models, seismic data (p-formats) and many more data types. Several of our QC tools are available in both the NaviModel Analyser and Producer variants, while others can be purchased with a QC toolbox add-on.
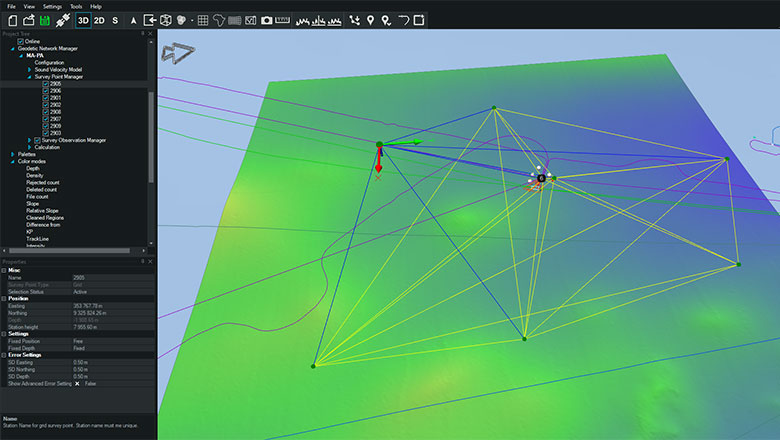
Undertake acoustic network adjustment and QC in NaviModel
Custom software tools
If there is a feature you are missing, you can always reach out to us for custom software development.
Learn how Njord uses EIVA as their single software provider for hydrographic surveys
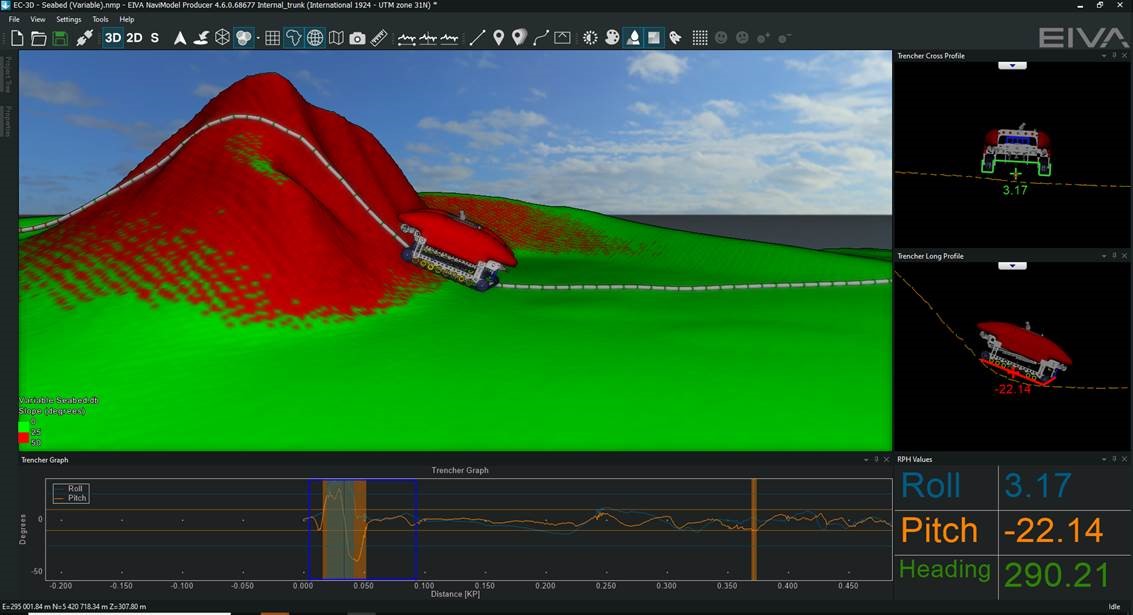
Learn how EIVA developed a NaviModel tool to simulate trenching for cable lay operations
Trencher tool developed as custom software fro Andrews Survey
-
General visualisation tools
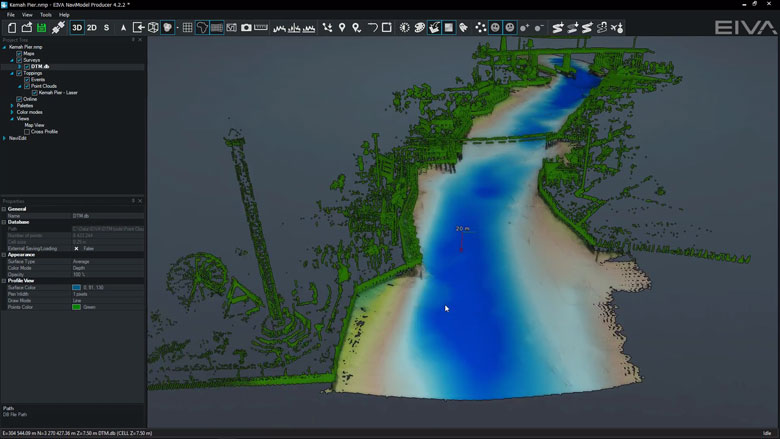
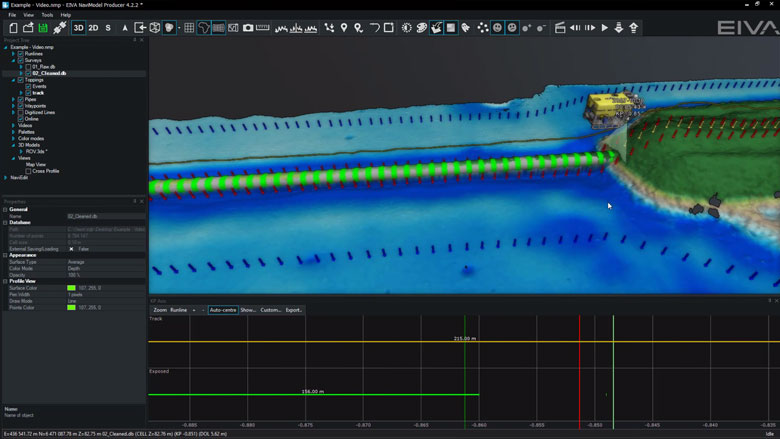
NaviModel and NaviPac share the same 3D engine, and therefore the same powerful 3D visualisation features. Data can be visualised in 2D, 3D, side view or by time.
General visualisation features
NaviModel and NaviPac share the same 3D engine, and therefore the same powerful 3D visualisation features. Data can be visualised in 2D, 3D, side view or by time.
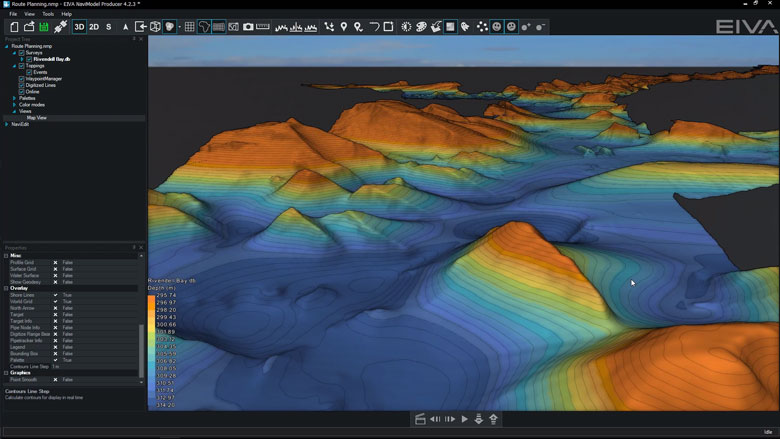
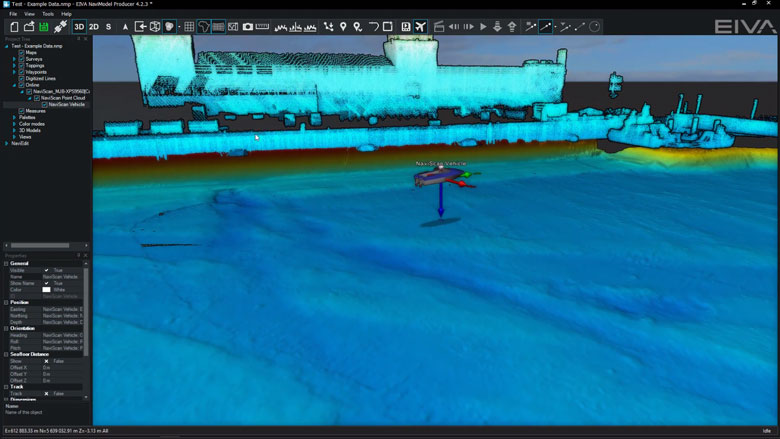
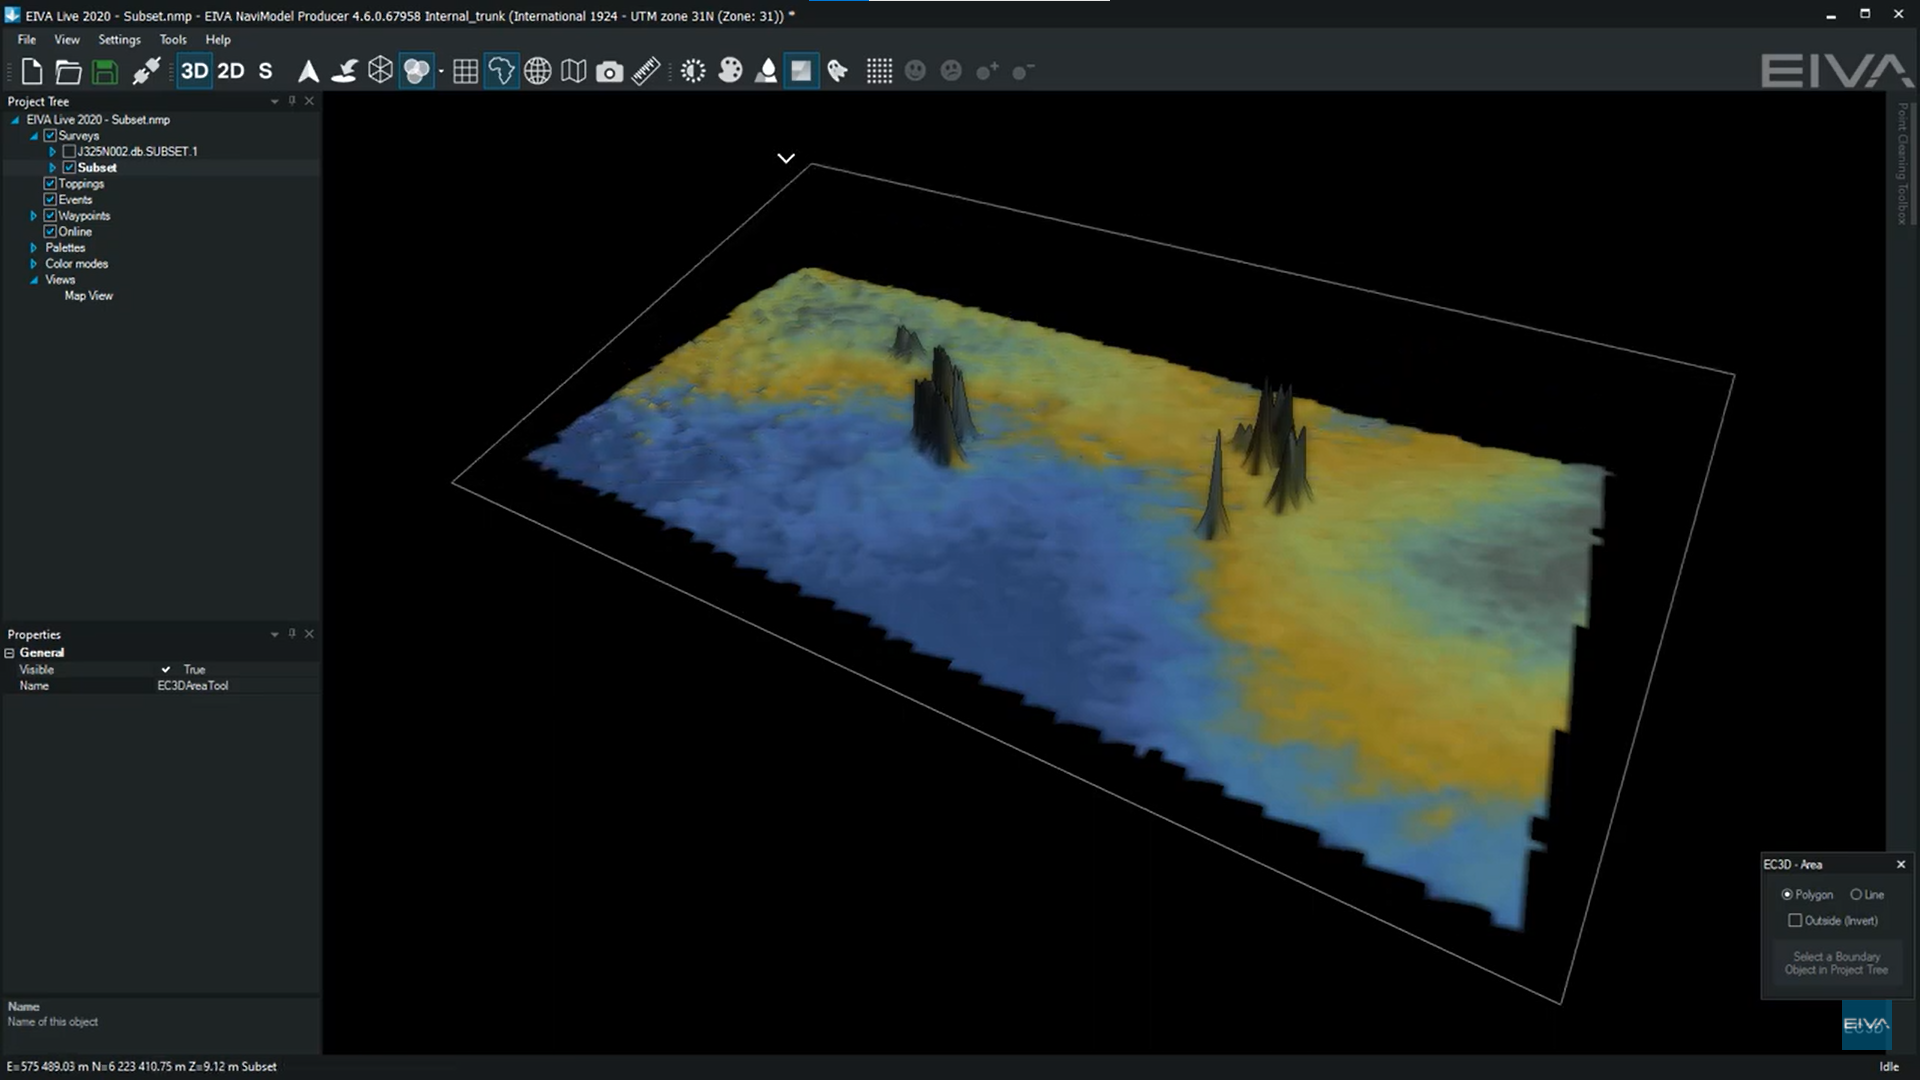
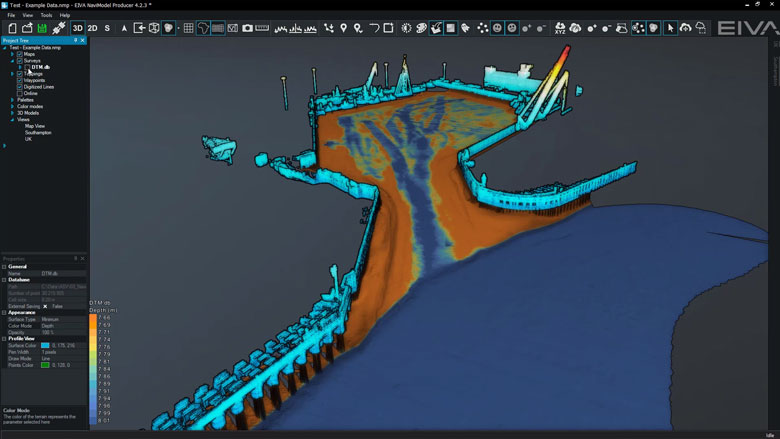
3D seabed terrain
Seabed terrain can be visualised in a 3D environment.
Multiple Map Views
Multiple Map Views are available. Each individual Map View window can be configured separately to display only the information required.
Background Maps
Background Web Map Service (WMS) maps can be displayed.
Import 3D models
3D models can be imported into NaviModel (drag and drop into the Map View window).
Link 3D models to live objects
3D models can be linked to any live objects (Vessel, ROV, Scanfish etc).
2D, 3D and side-view displays
2D, 3D or Side views allows the user to quickly change the view facilitating better data interpretation.
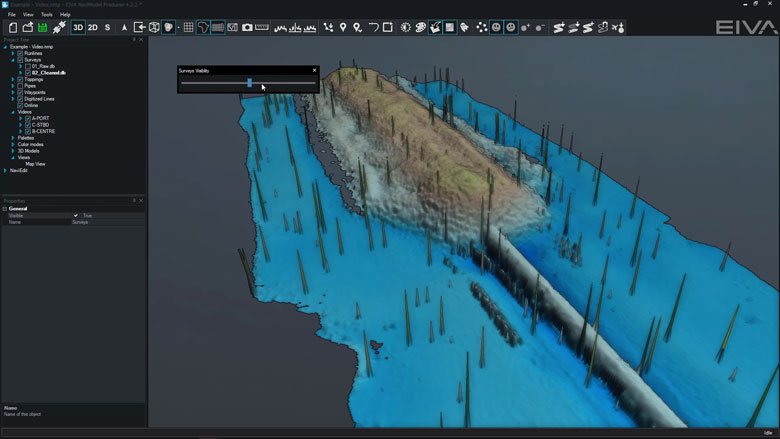
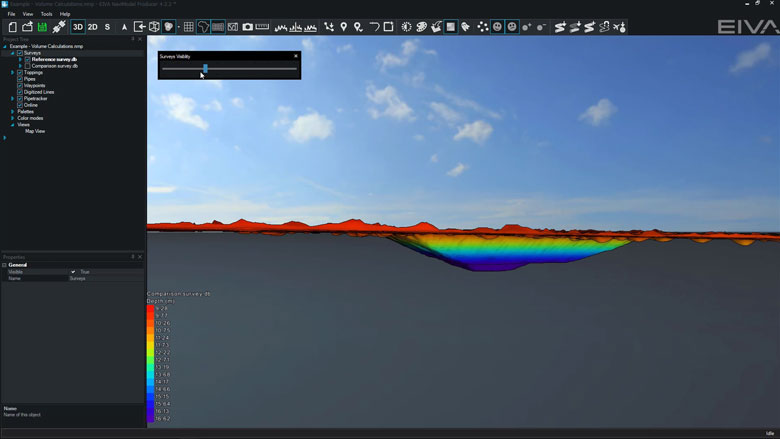
Visibility Slider
Visibility slider allows users to compare different DTM’s quickly. This enables comparison over time or between different data processing methods.
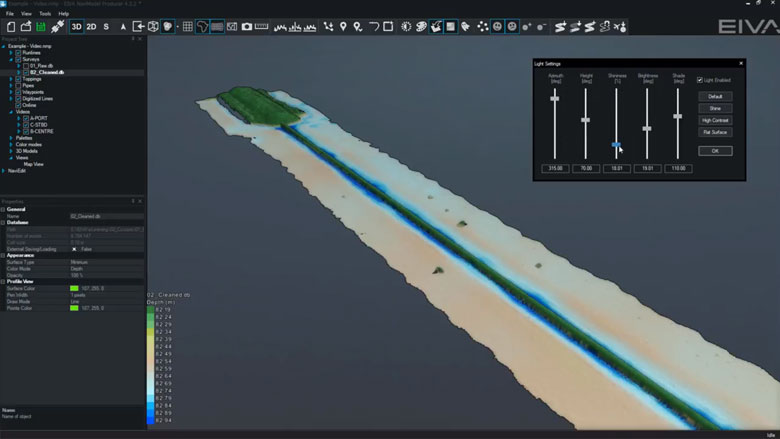
Control colours, lights, details
DTM light and palette settings can be changed at any time.
Profile views
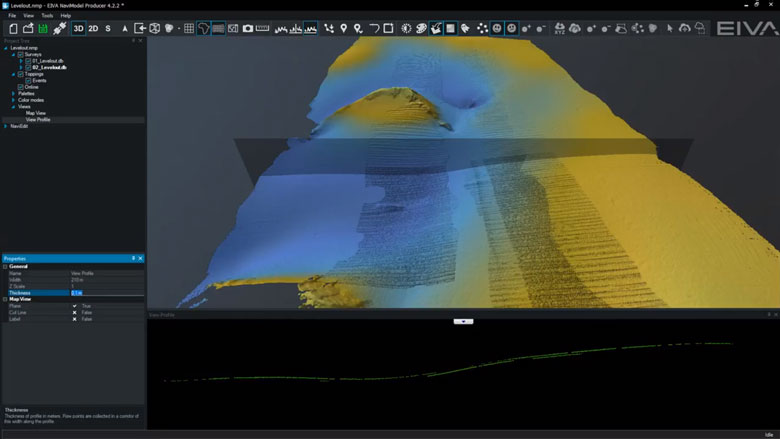
The following profile views are available:• Cross Profile• Long Profile• Quick Profile• X & Y Axis Profile• View Profile
Create fly-through videos
Fly-through videos can be created for project or promotional presentations.
-
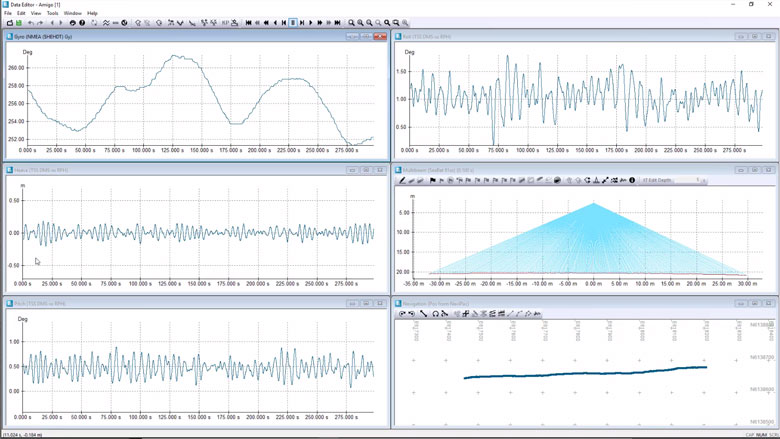
Sensor processing
NaviEdit can be used to recalculate data very quickly and where our sensor processing takes place. Here we change offsets, C-O’s, mounting angles, apply tide, apply SVP, de-spike sensors, improve object positioning, Kalman filtering, remove swell etc.
Sensor processing features
NaviEdit can recalculate data very quickly and where sensor processing takes place. Here we change offsets, C-O’s, mounting angles, apply tide, apply SVP, de-spike sensors, improve object positioning, Kalman filtering, remove swell etc.
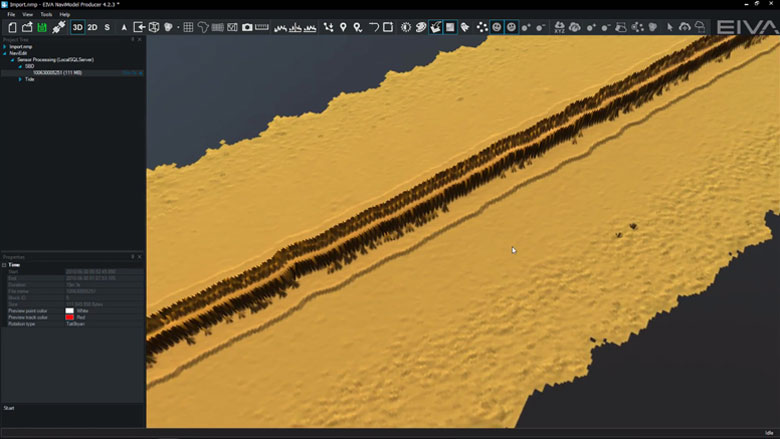
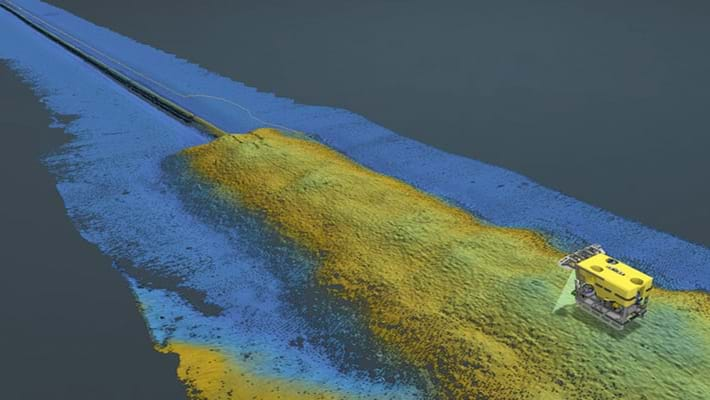
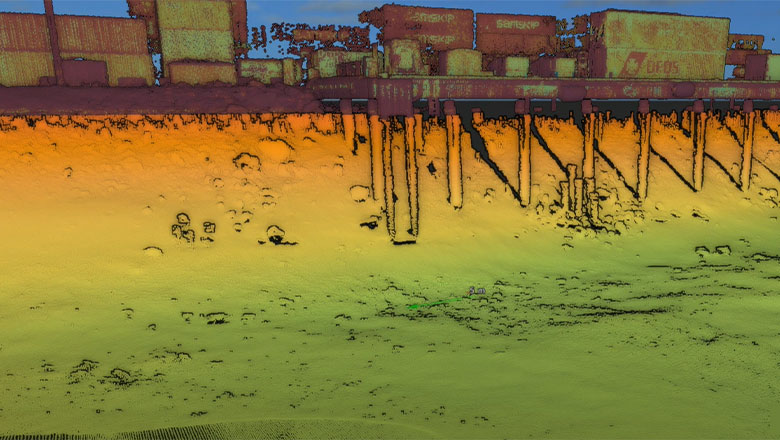
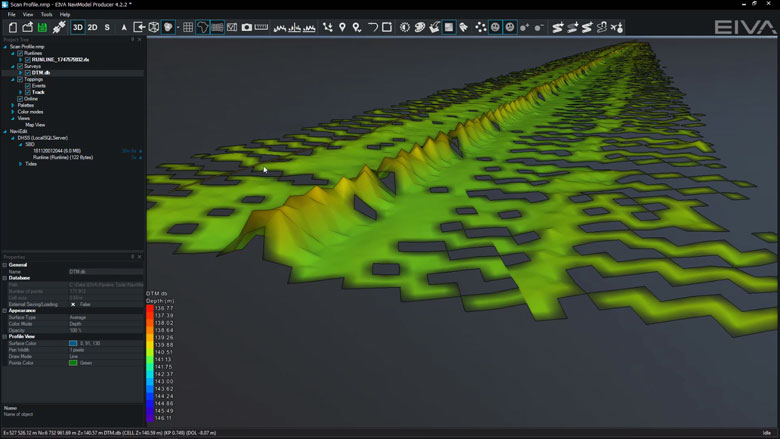
Multibeam echosounder (MBE)
MBE data can be both acquired and modelled in NaviSuite.
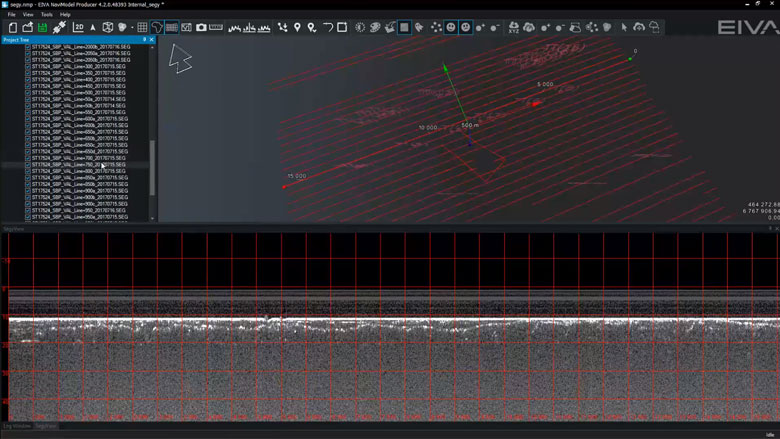
Sub-bottom profiler (SBP)
You are able to work with several SEG-Y files in NaviSuite at the same time. When loading the sub-bottom profiling data, the software extracts a rough track that is then taken through a two-step process of extracting a point every 100 metres, and then refined to 3 metres.
-
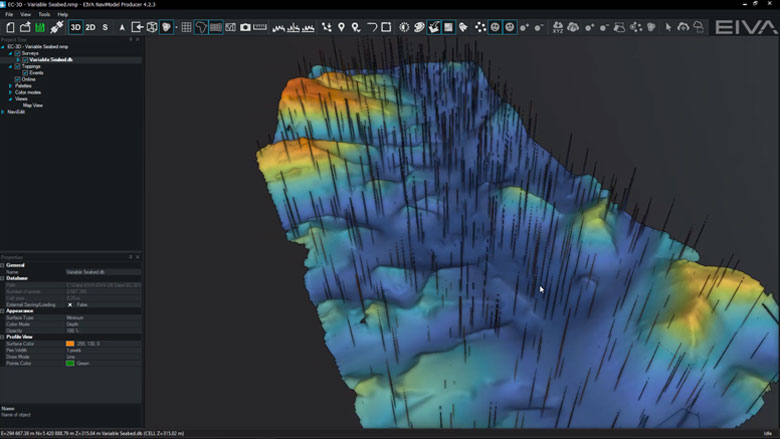
Sonar and subsea laser data cleaning tools
Clean point data with a plethora of tools: manual or automatic, real-time or post-processing.
Sonar and subsea laser data cleaning
Clean point data with a plethora of manual or automatic tools. Cleaning operations can be applied multiple times to a complete data set or user-defined areas.
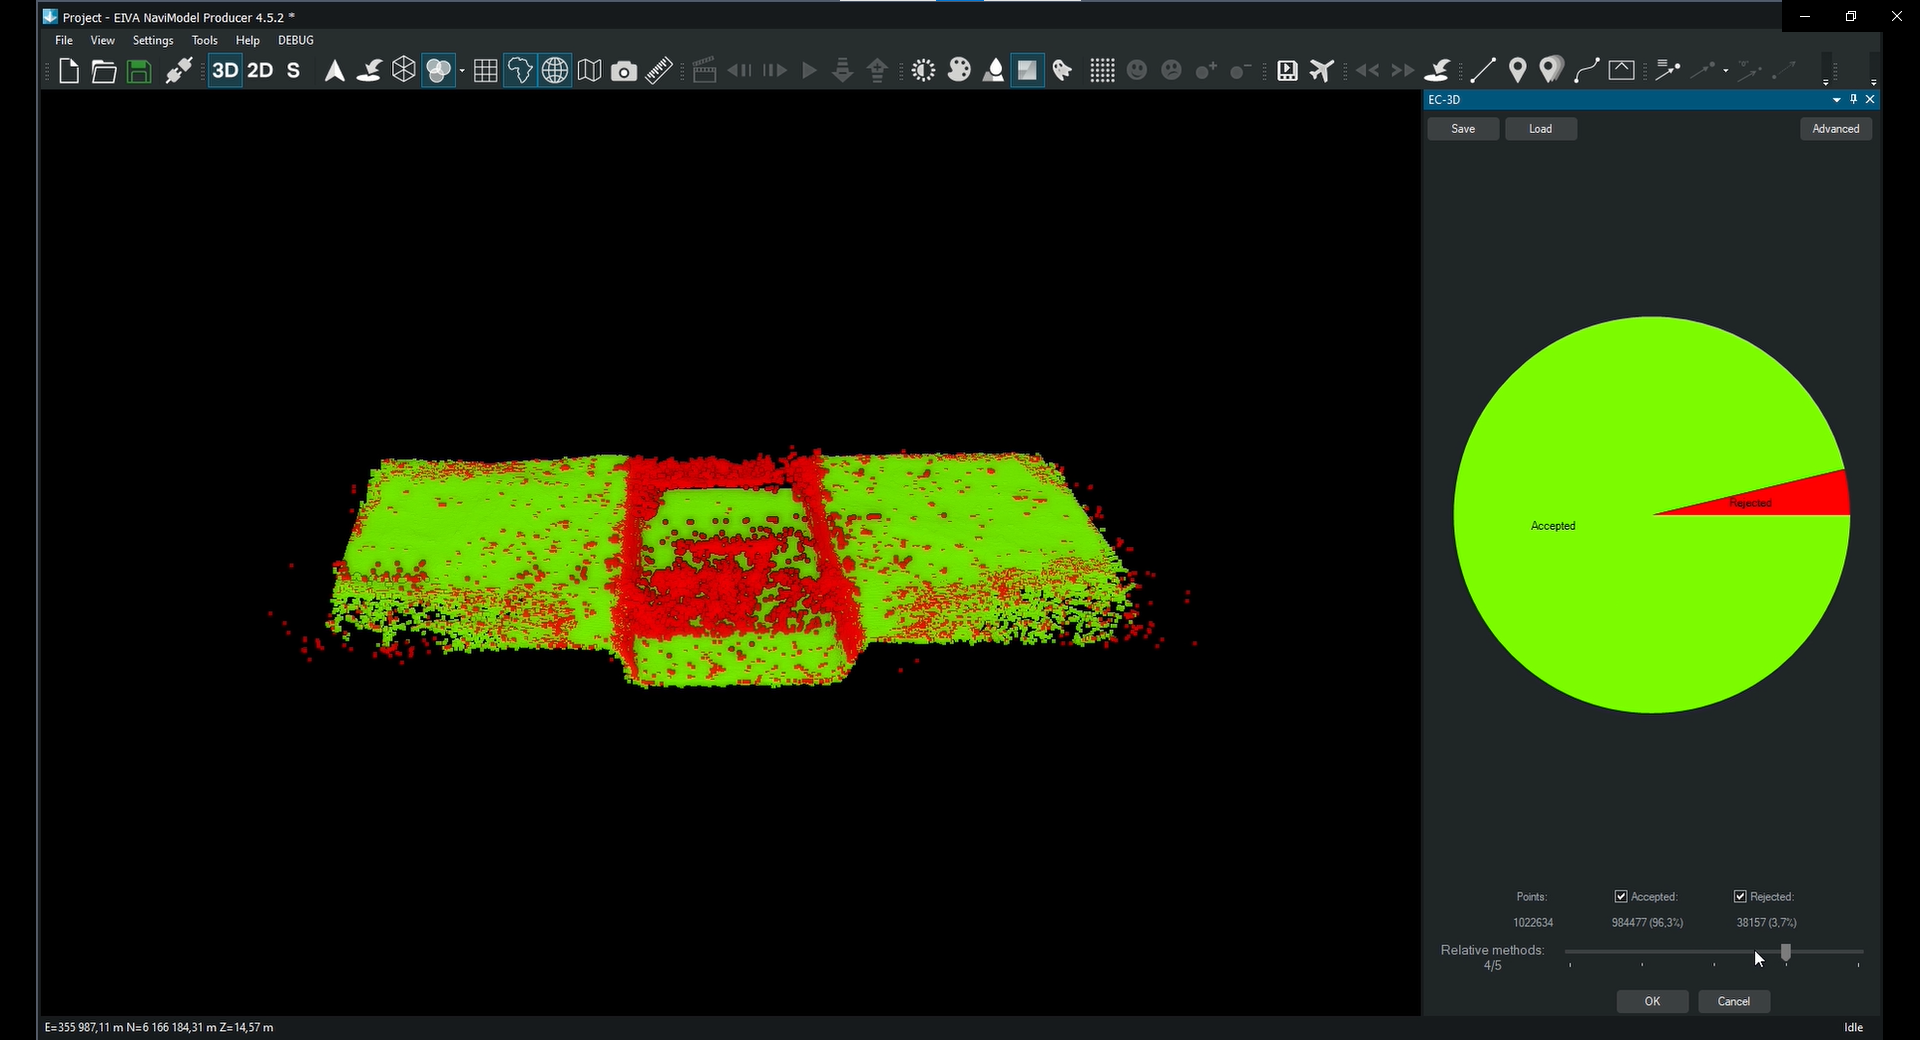
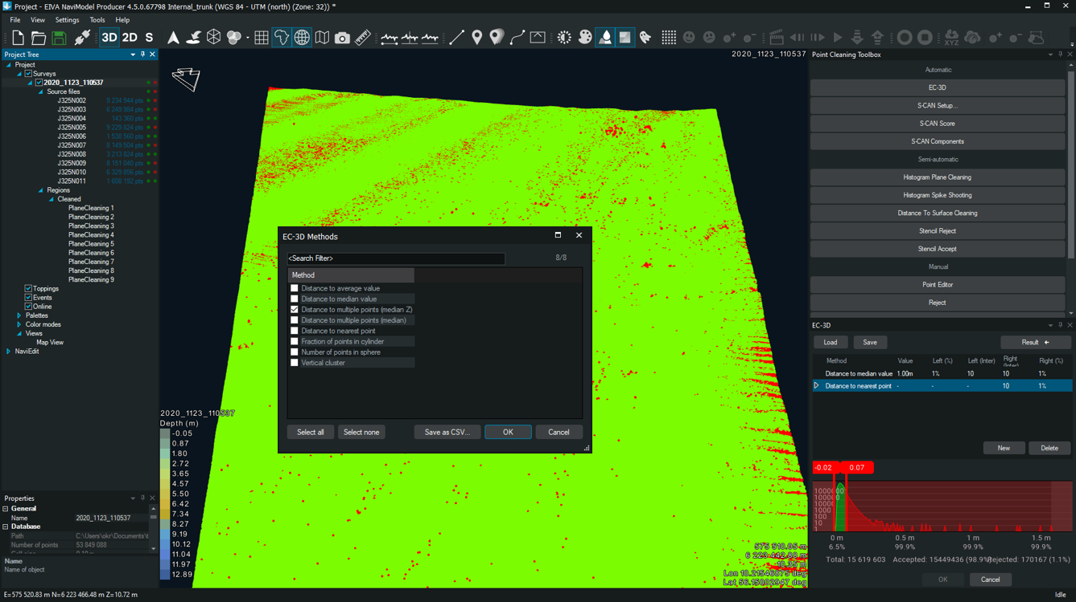
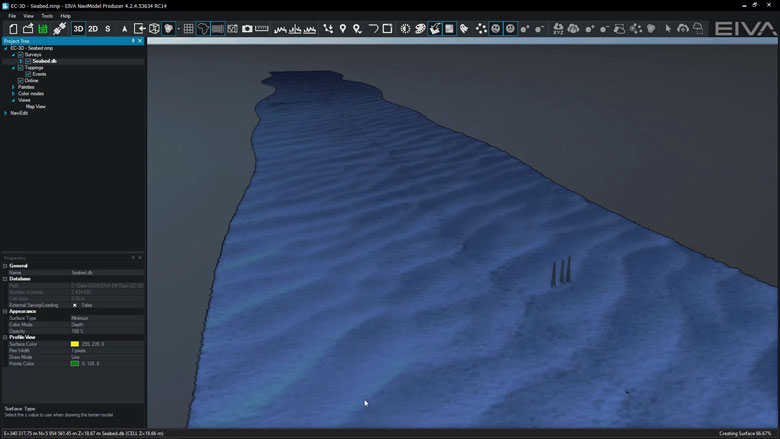
EIVA’s data cleaning tool EC-3D
EC-3D supports many automatic and manual data cleaning methods which can be customised and combined for optimal effect. EC-3D is efficient at cleaning data, whether it be 3D or 2D, point clouds or DTMs.
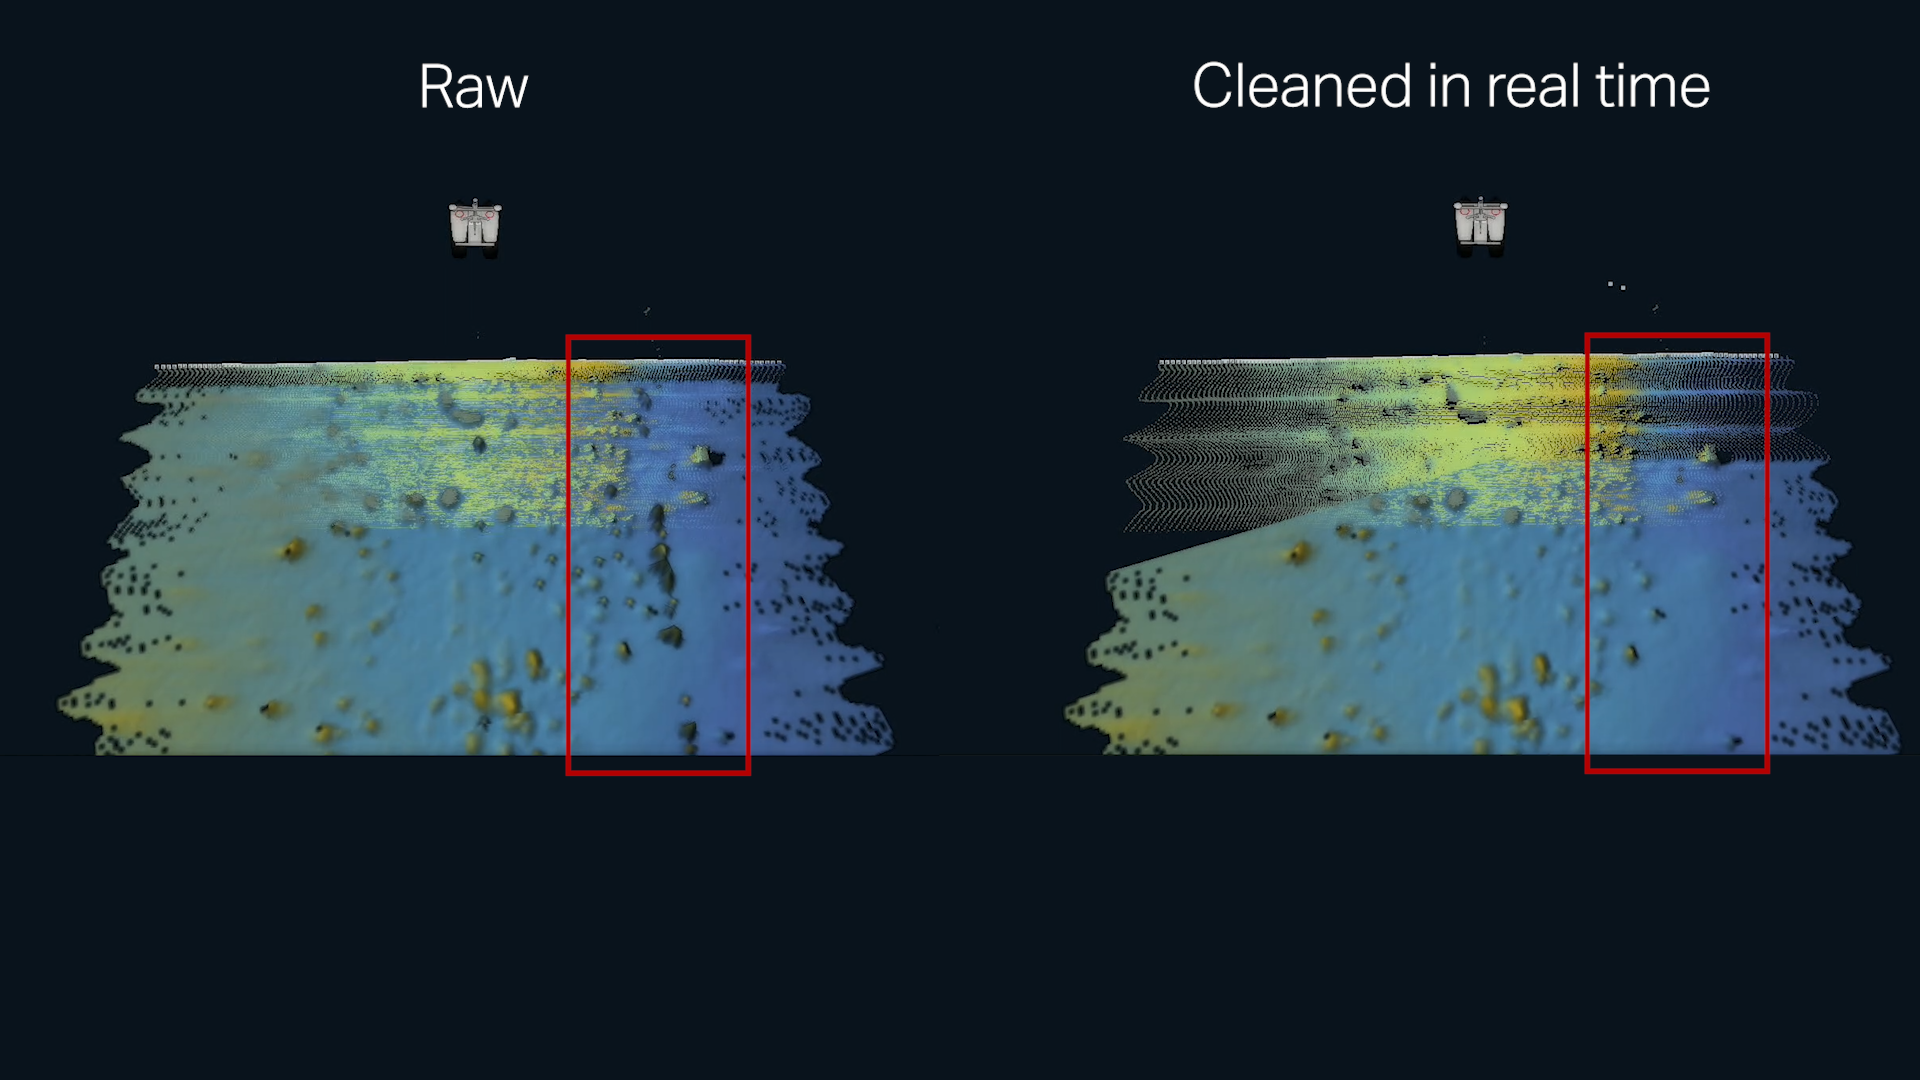
Real-time DTM cleaning
EC-3D cleaning filters can be applied to sonar data in order to clean data in real time as it is being acquired and displayed. The real-time DTM cleaning feature does not modify the acquired data – all the acquired sonar points are available for post-processing after the operation.
EC-3D point cloud cleaning
EC-3D can be used to clean point clouds.
EC-3D features many data cleaning methods
Rather than assuming one method will always work perfectly, with EC-3D, you can use a variety of different methods to identify noise in your data. The many data cleaning methods featured in EC-3D include…
- Histogram spike shooting
- Histogram plane cleaning
- Distance to surface (DTM only)
- Distance to average value
- Distance to mean value
- Distance to nearest point
- Distance to multiple points (median Z)
- Distance to multiple points (median)
- Number of points in a sphere
- Fraction of points in cylinder
- Vertical cluster
You can import and customise the parameters of individual cleaning methods.
Combine cleaning methods
You can run multiple cleaning methods simultaneously, combined in different ways. You can save and load your EC-3D method configurations, so you can use them again on several data sets.
When combining cleaning methods, you can group them as Relative or Absolute. Absolute methods will clean points regardless of any other cleaning method. While Relative methods will clean points in voted-based manner. For example, ‘at least two out of four methods must agree on a point being marked as noise before it is removed’.
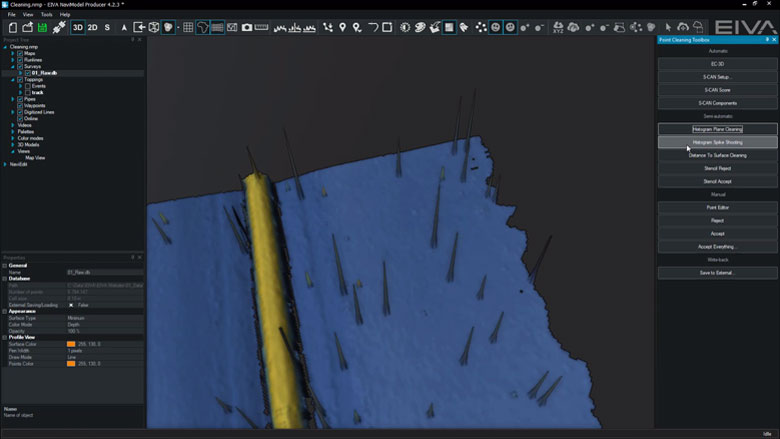
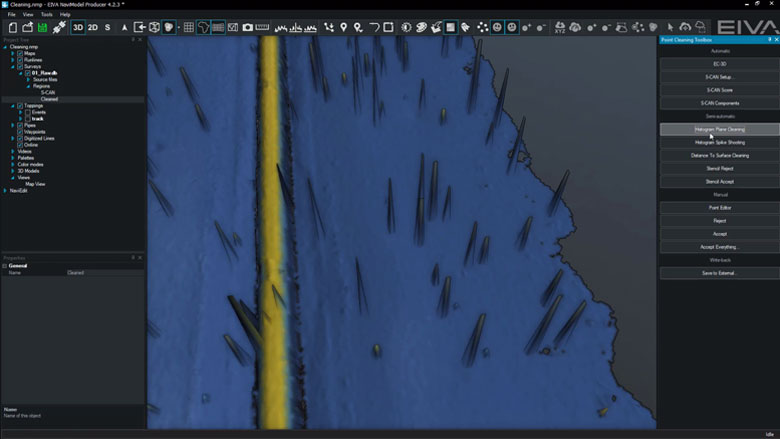
Histogram Spike Shooting
Histogram Spike Shooting can be used to reject or accept DTM points.
Points are selected if they are inside a circle.
Histogram automatically sets the rejection thresholds (can be manually over-ruled).
Histogram Plane Cleaning
Histogram Plane Cleaning tool can be used to reject or accept DTM points.
Points are selected if they are inside a corridor, polygon or an existing boundary.
Histogram automatically sets the rejection thresholds (can be manually over-ruled).
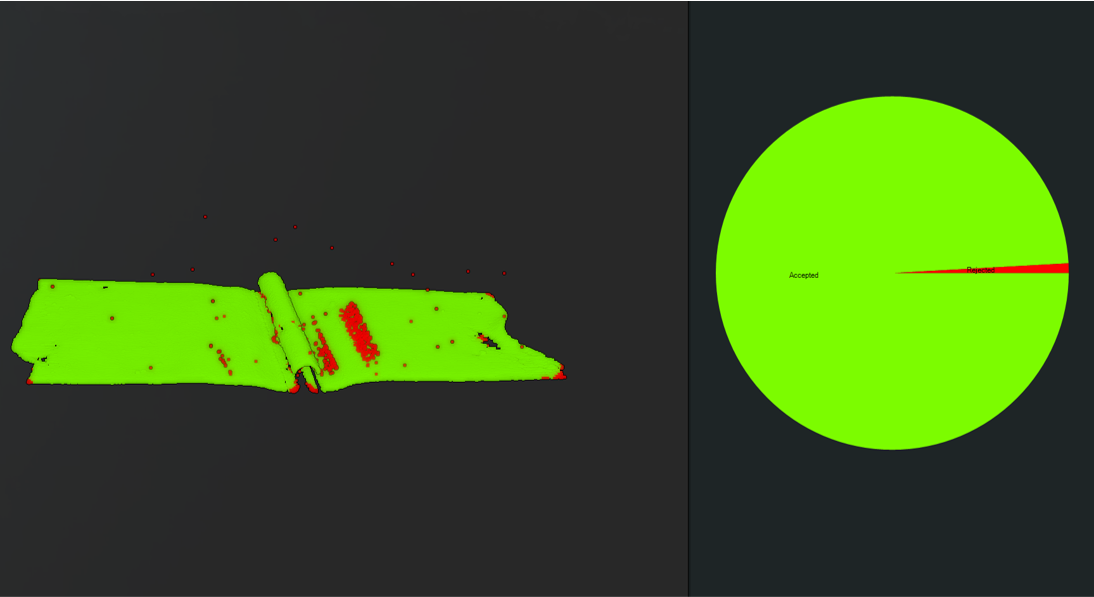
Reject & accept points
You can see which points are being rejected or accepted both on a DTM and in a pie chart to visualise the distribution of accepted and rejected points.
-
Point cloud tools
Create point clouds from sonar and laser systems or from historical XYZ files. Within NaviModel, there are many ways to visualise, edit and optimise point data.
Point cloud features
We can create point clouds from sonar and laser systems or from historical XYZ files. Within NaviModel, there are many ways to visualise, edit and optimise point data.
Import XYZ files
You can easily model historical data in NaviSuite Kuda and use it for example to plan your survey or compare your results with earlier observations. If you have data in a known format, such as generic ASCII XYZ files, these can be imported as DTMs, point clouds, or TIN models.
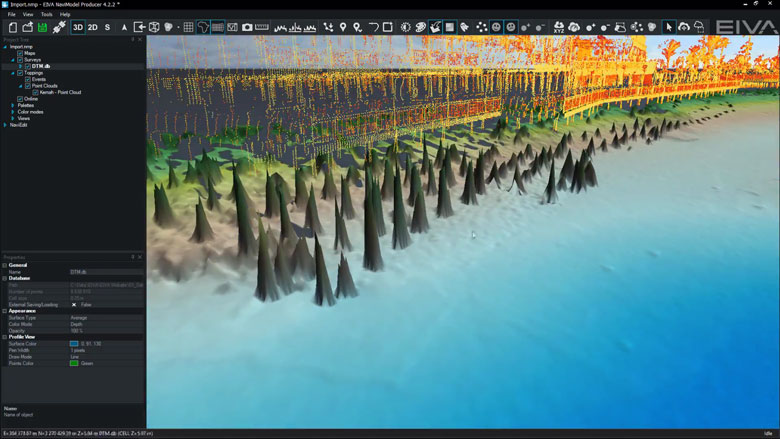
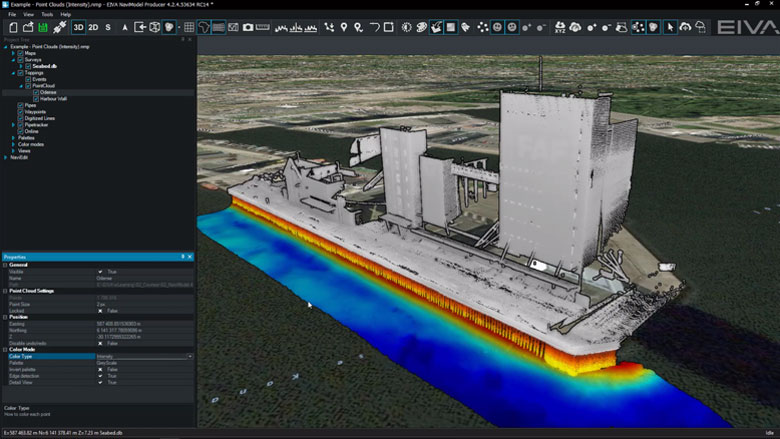
Point clouds with RGB and Intensity
By default, point clouds can be visualised as a solid colour or as a depth palette. However, if source files contain RGB or Intensity values, we can choose to colour the point cloud with this information instead.
EC-3D point cloud cleaning
EC-3D can be used to clean point clouds.
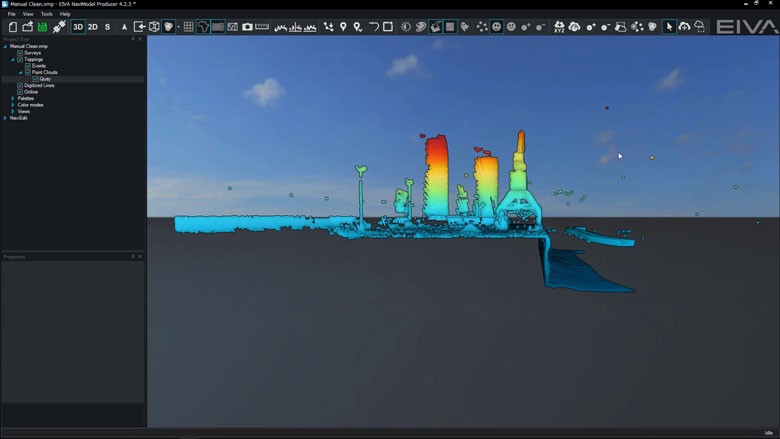
Manual cleaning
A selection window or a polygon can be used to manually clean point clouds.
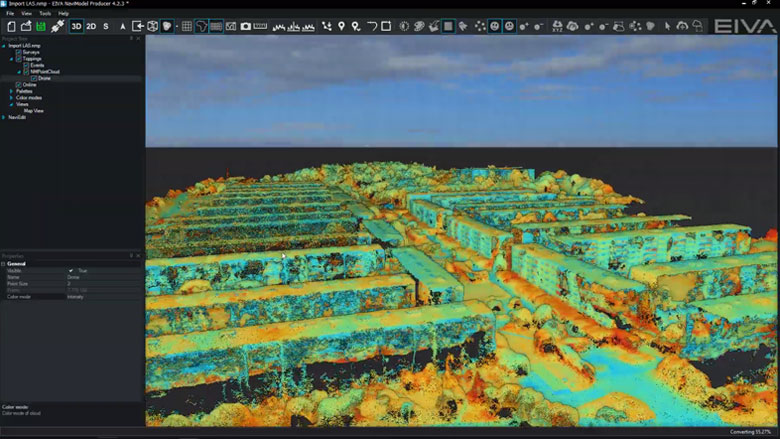
Import LAS files and display as RGB or Intensity
LAS and LAZ files can be imported as DTMs or as point clouds, meaning you can use NaviSuite’s powerful modelling capabilities for validating data in this format. You can also export your model to this format.
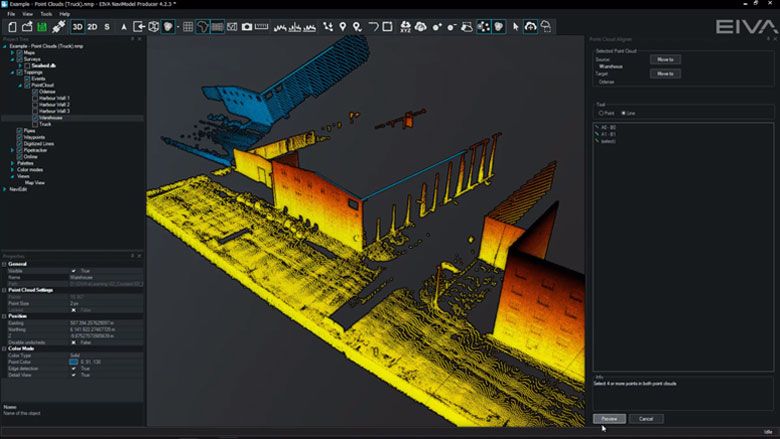
Point Cloud Registration (QuickStitch)
If point clouds are misaligned, we can use Point Cloud Registration to align them. We accomplish this by first digitising common features, and then performing a least-squared adjustment that moves one point cloud to another.
-
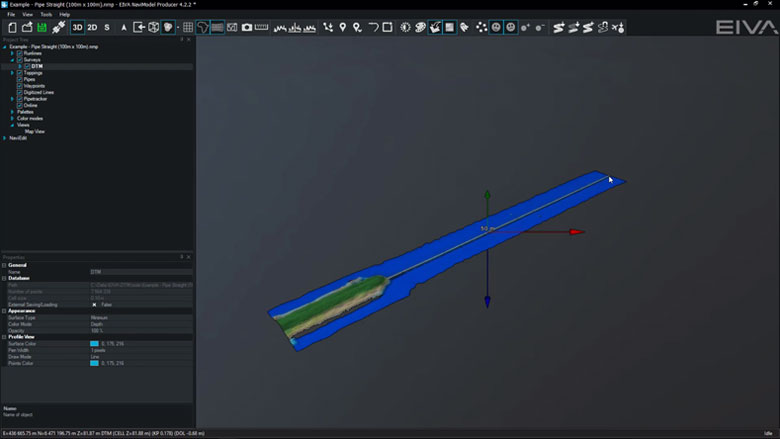
DTM tools
In NaviSuite Digital Terrain Models (DTMs) can be generated, manipulated, and edited with the help of various tools.
DTM features
In NaviSuite, Digital Terrain Models (DTMs) can be generated, manipulated, and edited with the help of various tools.
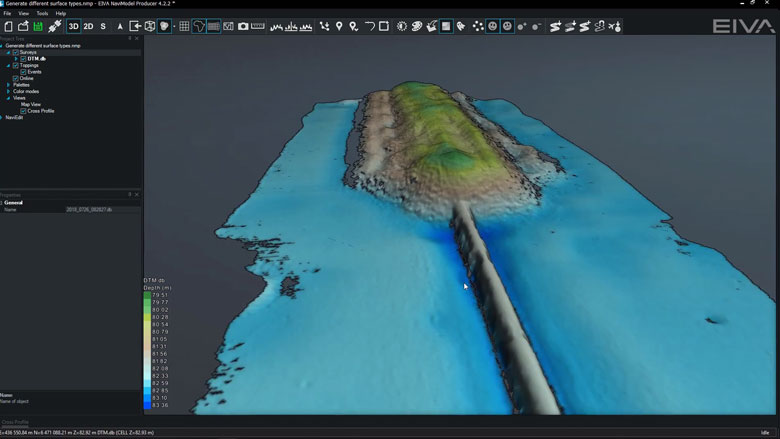
Create DTM surface from points (sonar & laser)
DTM surfaces and Point Clouds can be generated at any time from either sonar or laser data.
Create different DTM surfaces (mean, max, min, etc) and colour modes
Different surface types are generated upon data import and can be accessed at any time.
Light and Palette settings
DTM light and palette settings can be changed at any time.
Visibility Slider
Visibility slider allows users to compare different DTMs quickly.
This enables comparison over time or between different data processing methods.
Difference models
DTMs can be created from the differences between two other existing models.
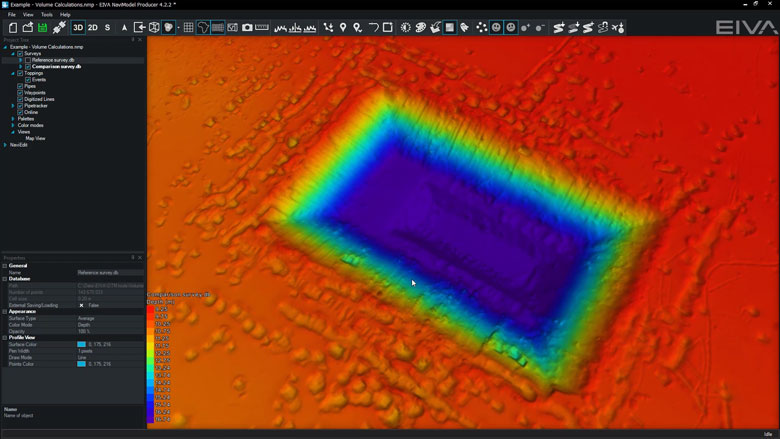
Volume calculation
A volume calculation is the difference between a reference surface and a comparison surface.Surfaces can be from a DTM or a TIN model.Volume calculations can take place between the following models:• DTM vs DTM• TIN vs TIN• DTM vs TIN
Density surface
Density colour mode can be enabled to QC how many points are in each DTM cell.
Custom surface
It is possible to create custom surfaces based upon hard-coded variables or user-configurable equations.
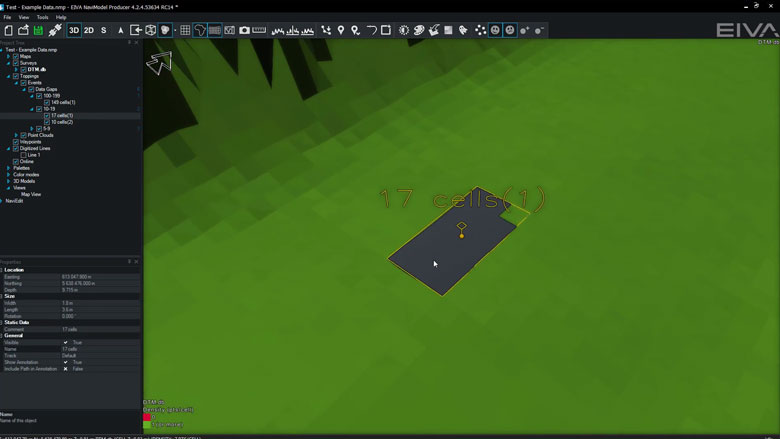
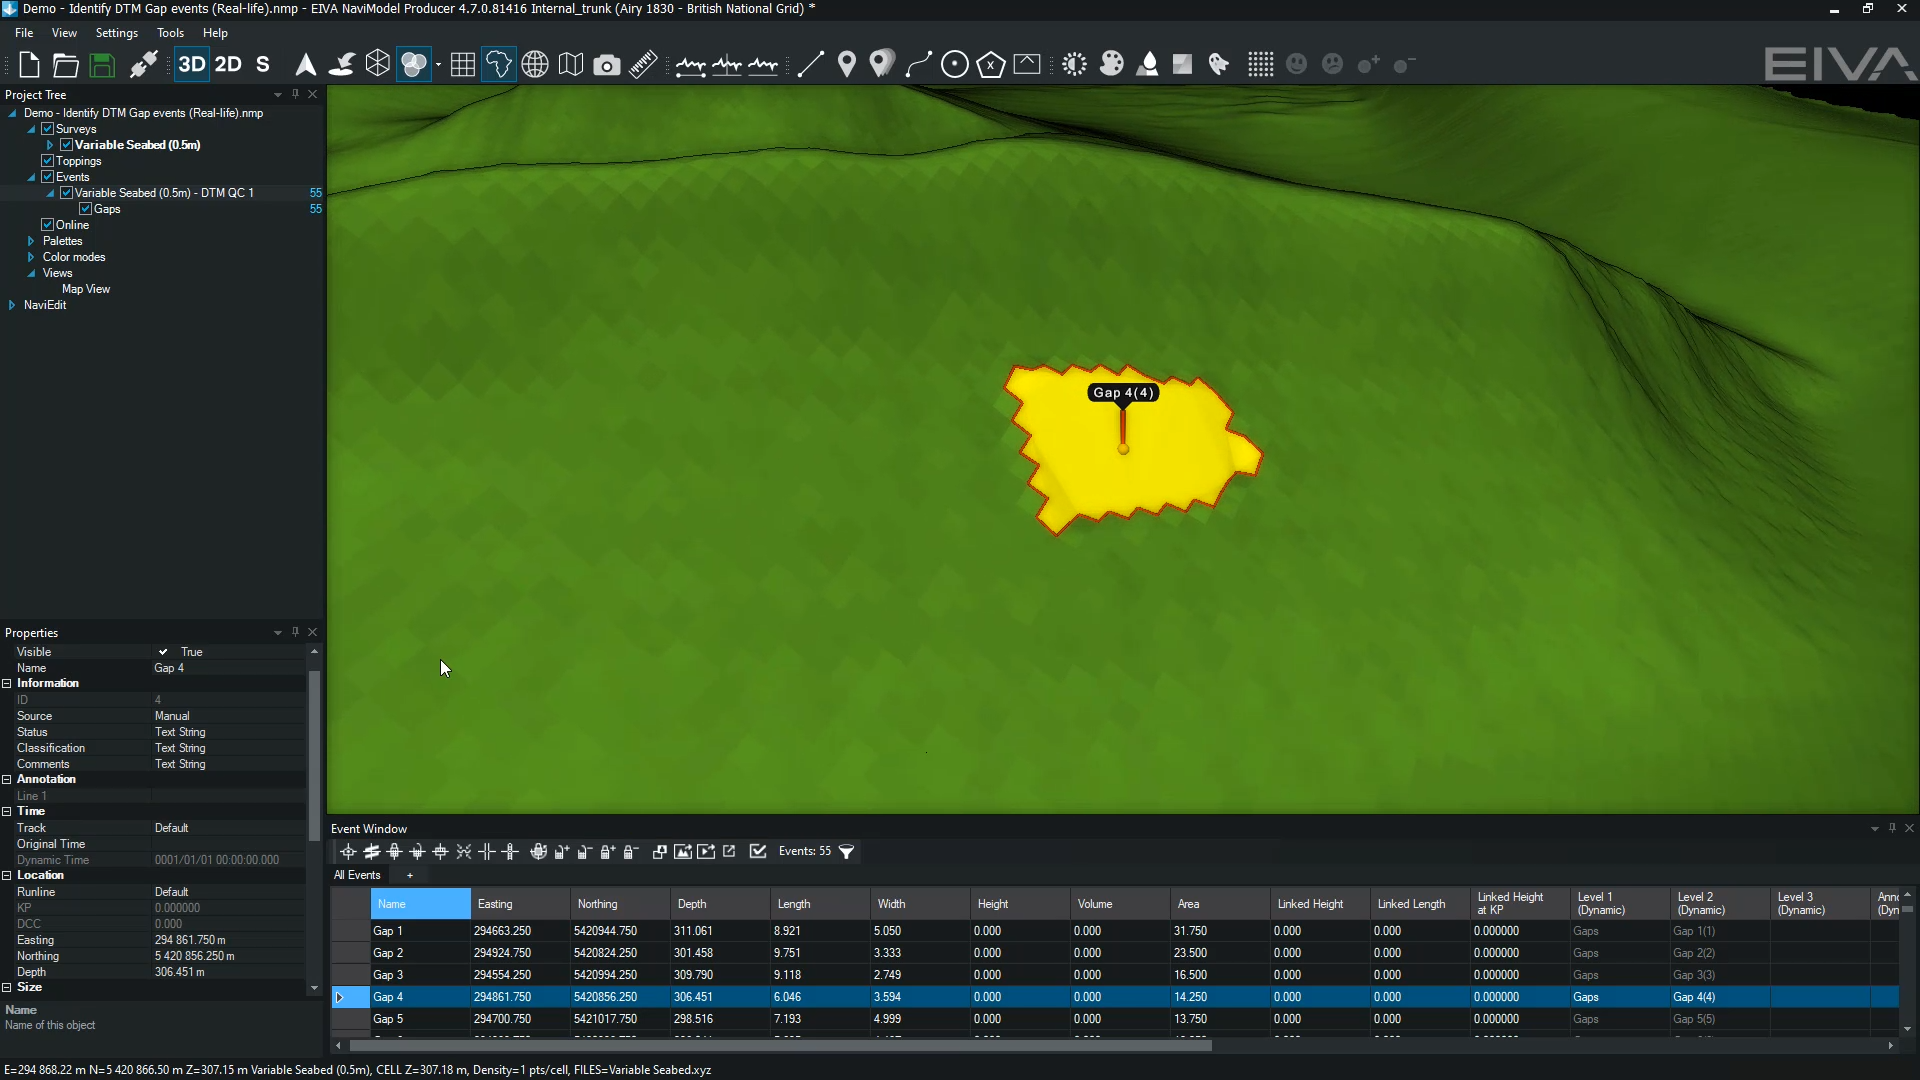
Automatic gap detection
This tool analyses DTMs to identify areas which have no coverage (i.e. contain gaps).
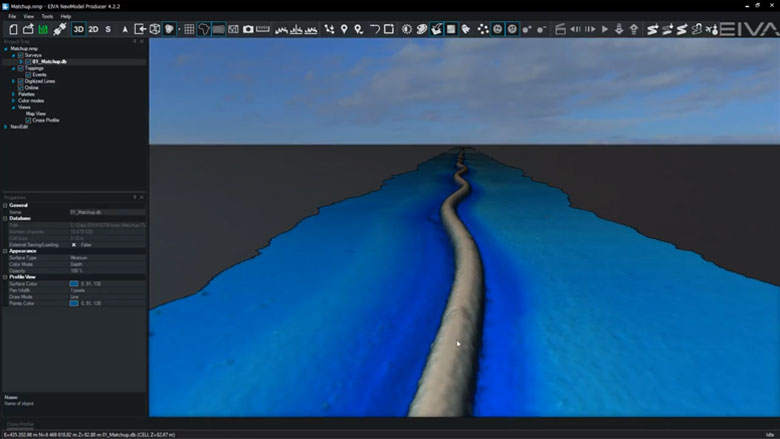
Matchup
Matchup tool can be used to correct for DTM artefacts caused by incorrect ROV XYZ position.
Points are moved based upon differences between two existing lines (source and destination).
Points are moved perpendicular to the destination line.
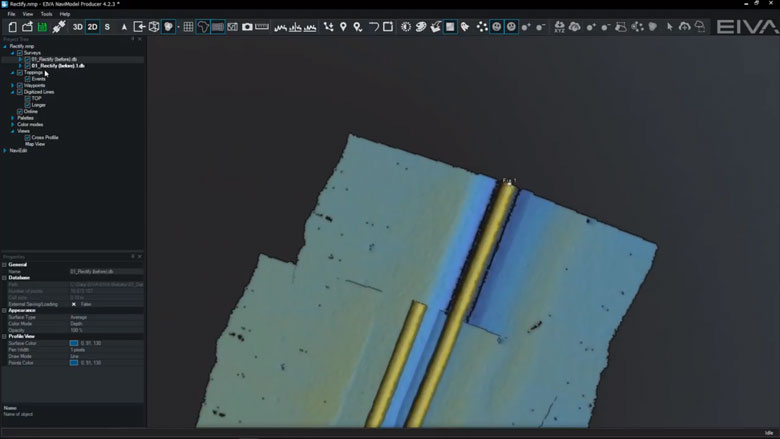
Rectify
Rectify tool can be used to correct for DTM artefacts caused by incorrect ROV XYZ position.
Points are moved based upon differences between two existing lines (source and destination).
Points are moved perpendicular and along length to the destination line.
Level out
Level out tool can be used to correct for small depth differences between surveys.
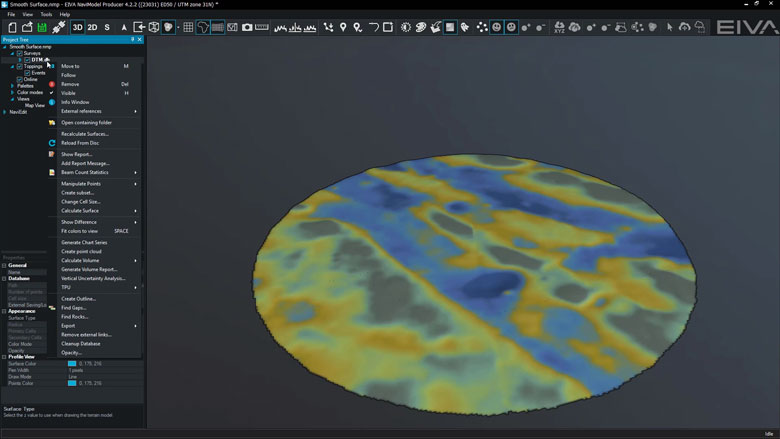
Smooth surface
Smooth surface tool smooths a DTM surface by an absolute distance or by the number of DTM cells.
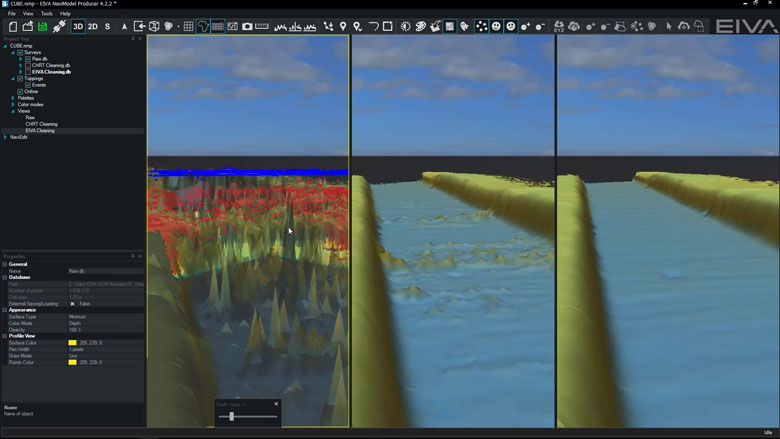
CUBE
Combined Uncertainty and Bathymetric Estimator (CUBE) tool is available in NaviModel and is implemented alongside our other cleaning approaches.
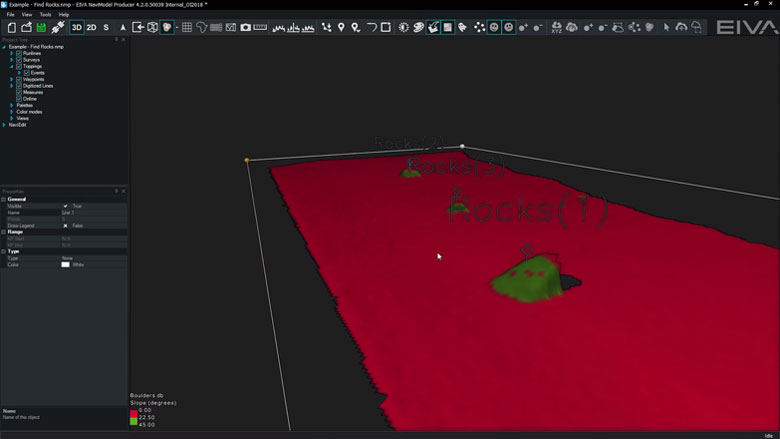
Find Rocks
This tool analyses DTMs to identify rock events.
-
Engineering/Construction Design
Within NaviModel, we can design trench or rock-placement profiles or import existing engineering drawings from various sources (AutoCAD).
Engineering/Construction Design features
Within NaviModel, we can design trench or rock-placement profiles or import existing engineering drawings from various sources (AutoCAD).
Find Rocks
This tool analyses DTMs to identify rock events.
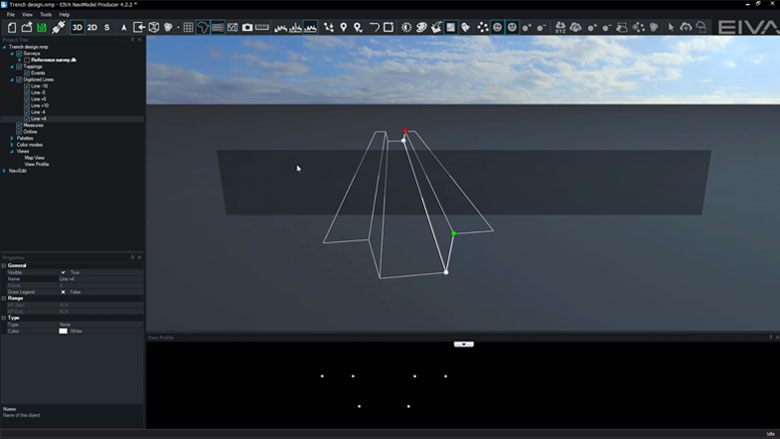
Trench design
In NaviModel theoretical trench profiles can be designed and visualised inside a 3D environment.
If available AutoCAD engineering drawings can also be used.
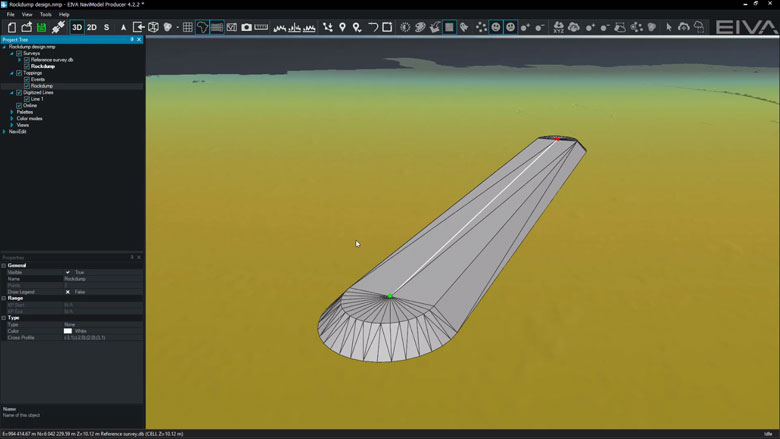
Rock-placement design
In NaviModel theoretical rock-placement profiles can be designed and visualised inside a 3D environment.
If available AutoCAD engineering drawings can also be used.
-
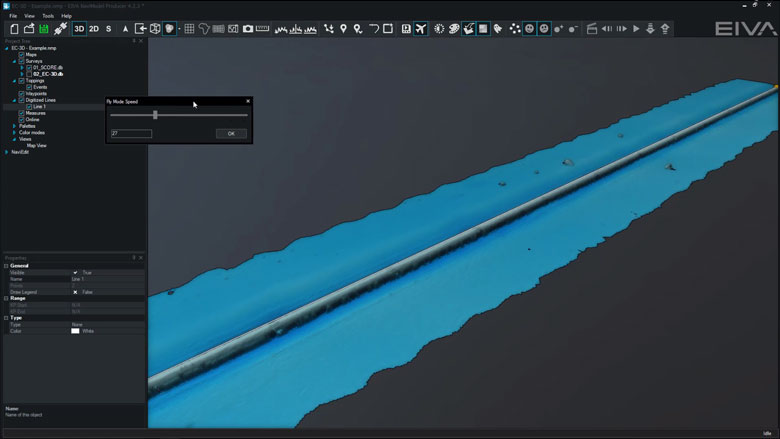
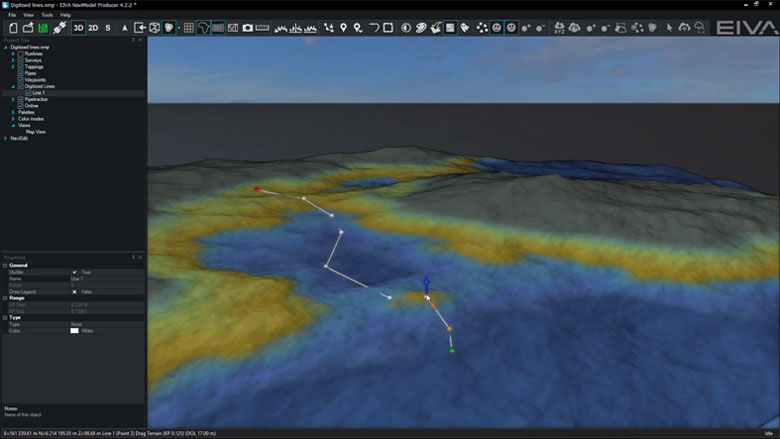
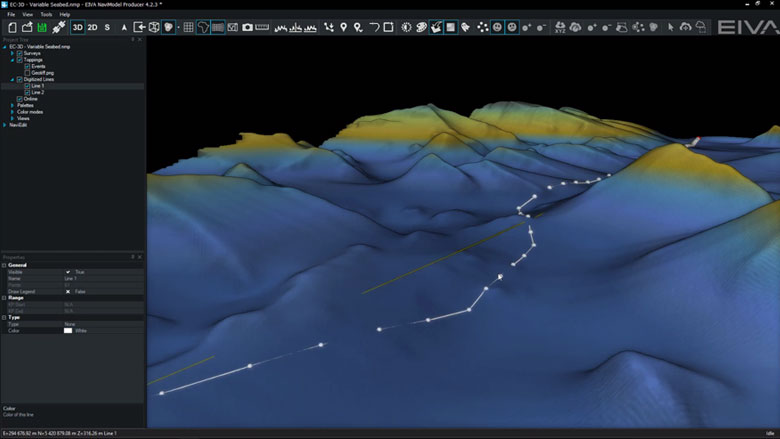
Line and track tools
We have a large range of tools to create, modify, graph and export lines that are digitised within NaviModel. Digitised lines are multipurpose and are used both online and offline. Some examples of digitised line usage include controlling pipelines and seabed marker positions, creating boundaries, engineering designs and runlines.
Line and track tool features
We have a large range of tools to create, modify, graph and export lines that are digitised within NaviModel. Digitised lines are multipurpose and are used both online and offline.
Modify lines
Lines can be modified in many different ways.
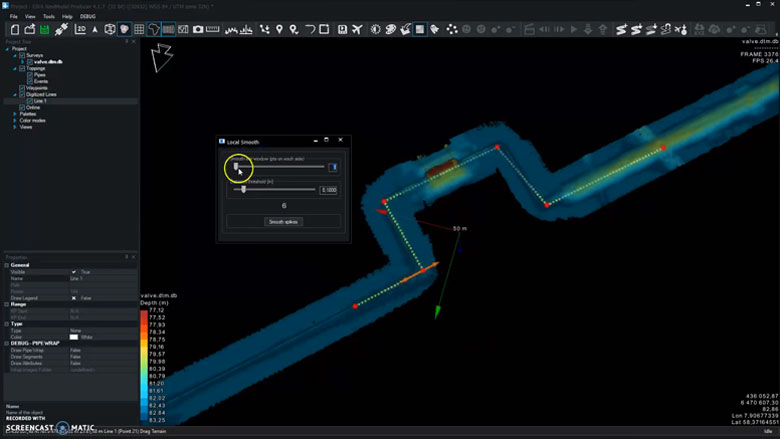
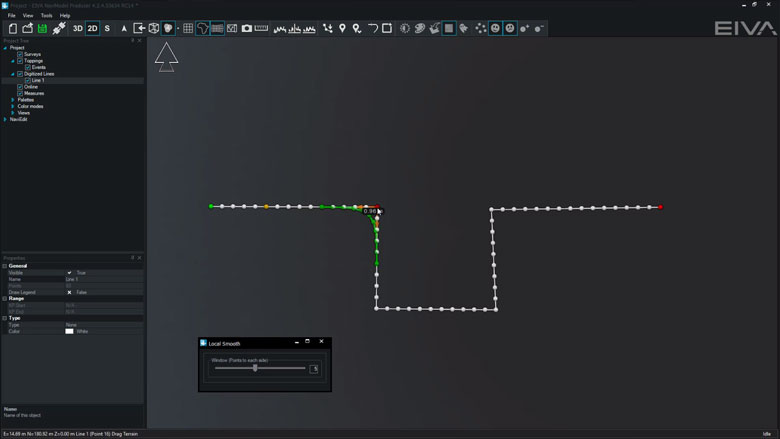
Line smooth
If required, the entire length of the line can be smoothed in XYZ.
Local smooth
Local smooth tool allows you to concentrate on small line sections that require remedial action.
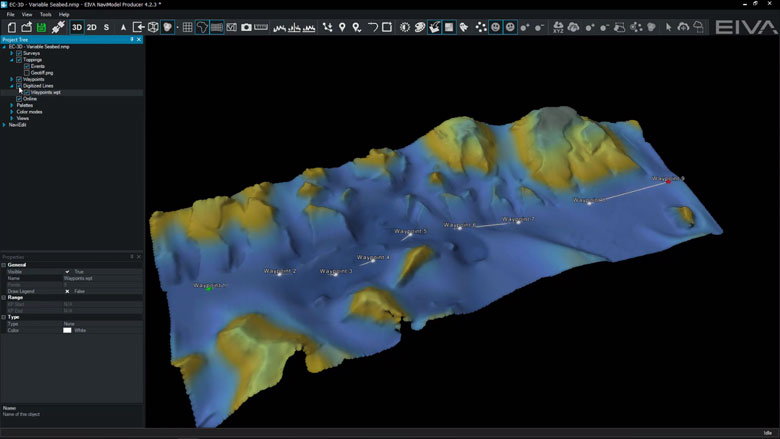
Convert waypoints to lines
Waypoints can be converted to lines via the ASCii Importer.
Compare lines
Whilst we can always compare lines visually in the Map View window, sometimes it is better to create graphs for comparison.
-
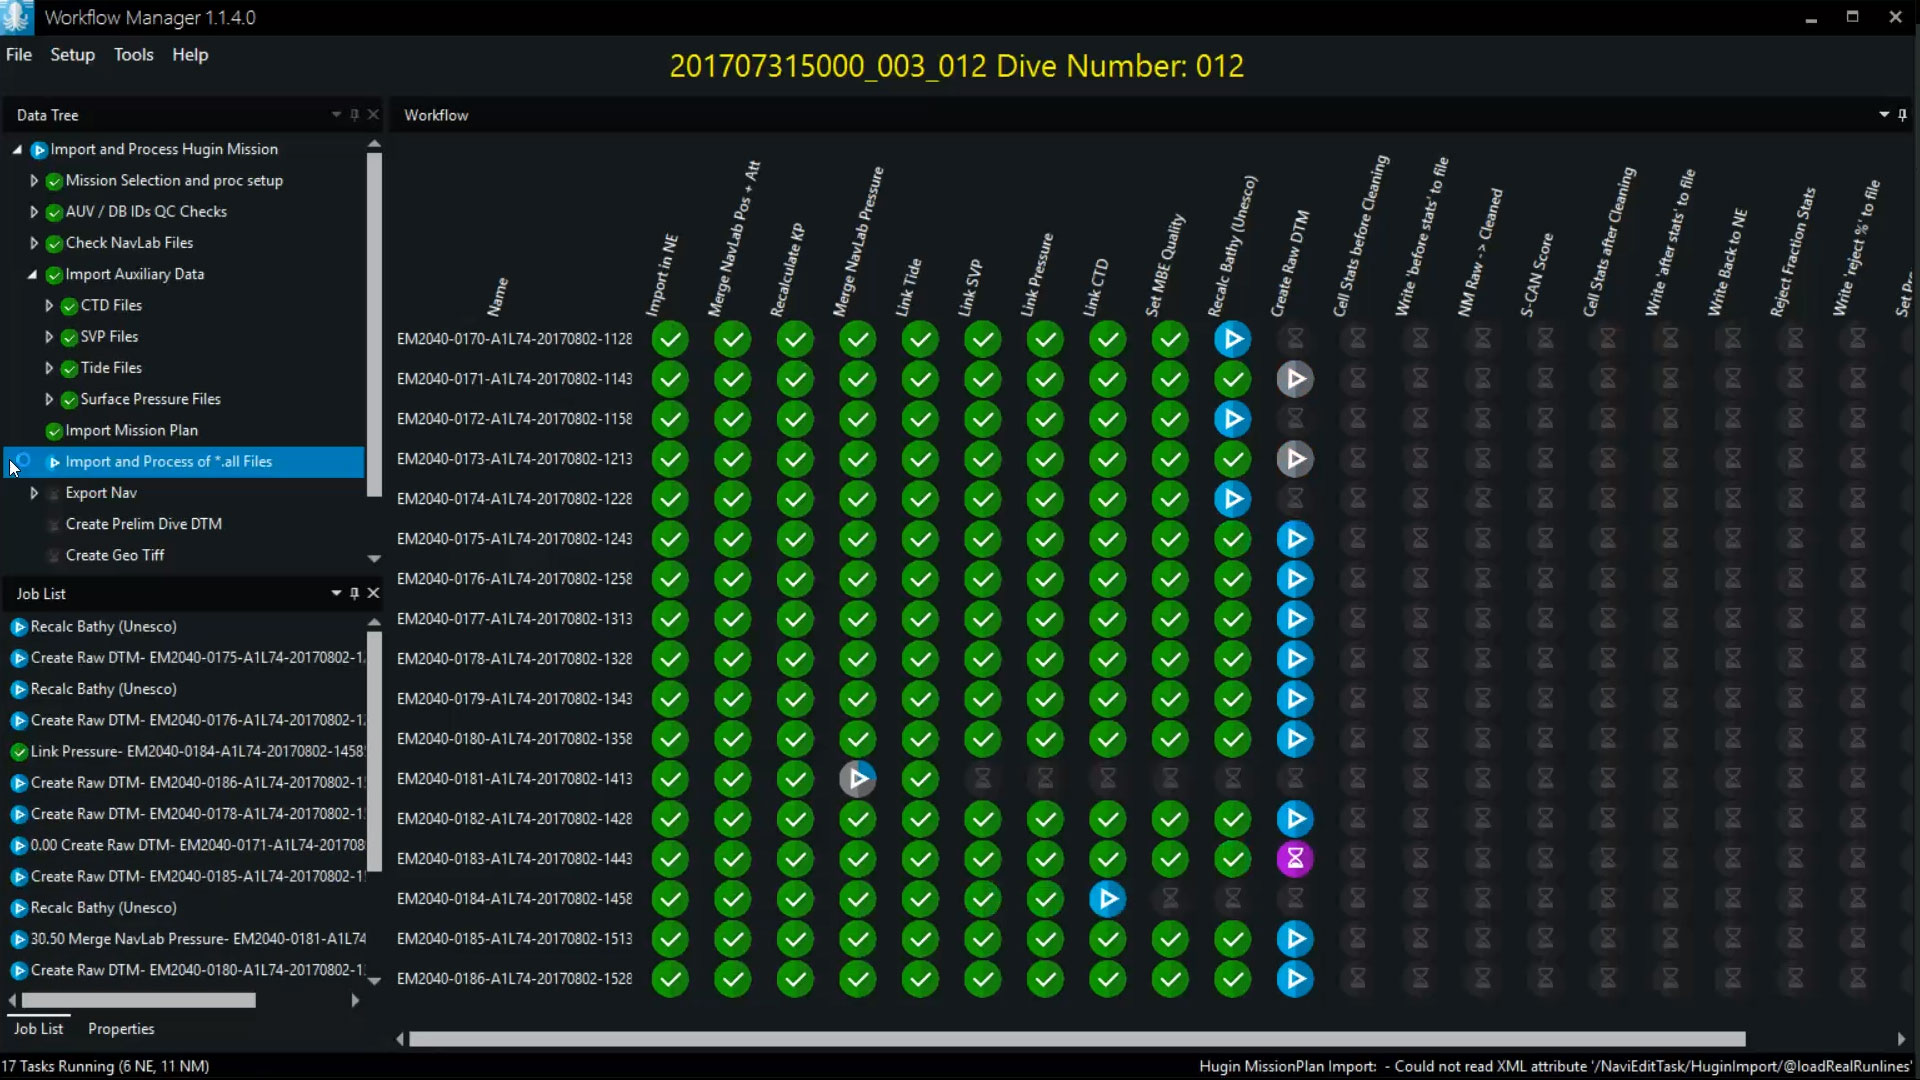
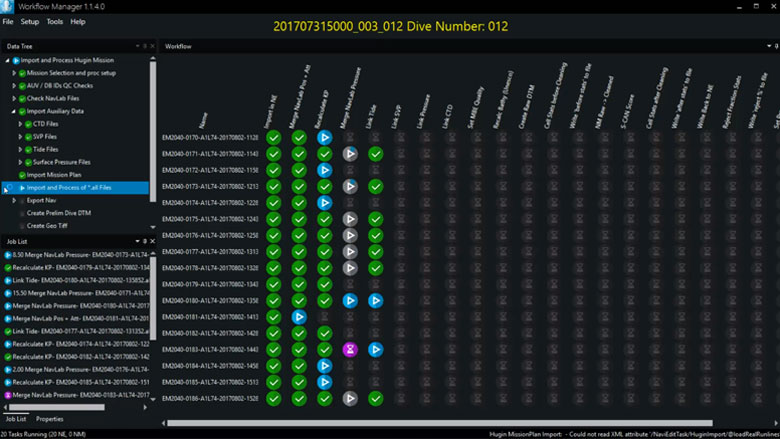
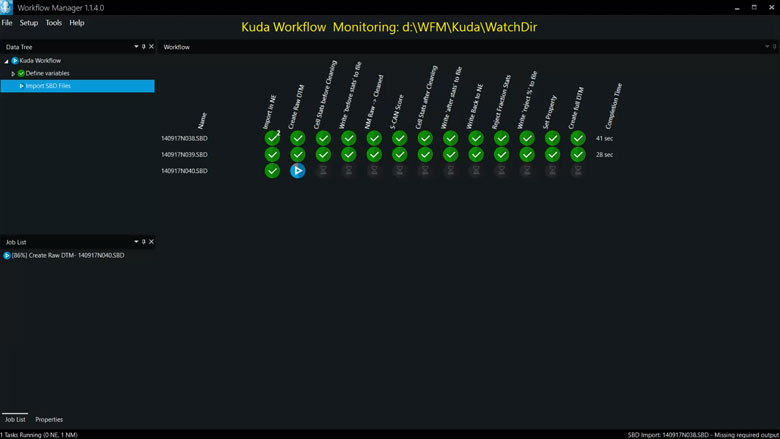
Automatic data processing tool
Save time on data processing by automating your workflow – using NaviSuite Workflow Manager, designed to enable a previously unseen degree of automatic data processing of massive amounts of subsea sensor data.
Automatic processing features
The NaviSuite Workflow Manager tool is designed to enable a previously unseen degree of automatic data processing of massive amounts of subsea sensor data.
AUV processing workflow
The first version of the Workflow Manager utilises NaviEdit and NaviModel for a traditional survey data set processing of data from AUV dive. As soon as the data is available, it is automatically loaded into the flow and processed by cleaning data, merging reprocessed AUV track, building DTMs and making sanity checks. This is typically done using the Server version.
NaviSuite Kuda processing workflow
The Workflow Manager desktop version is very well suited for NaviSuite Kuda operations where each file will be processed right after recording, thus enabling reporting and quality control as you go. The Desktop version runs one task at the time – but it is more than fast enough to cope with survey speed.
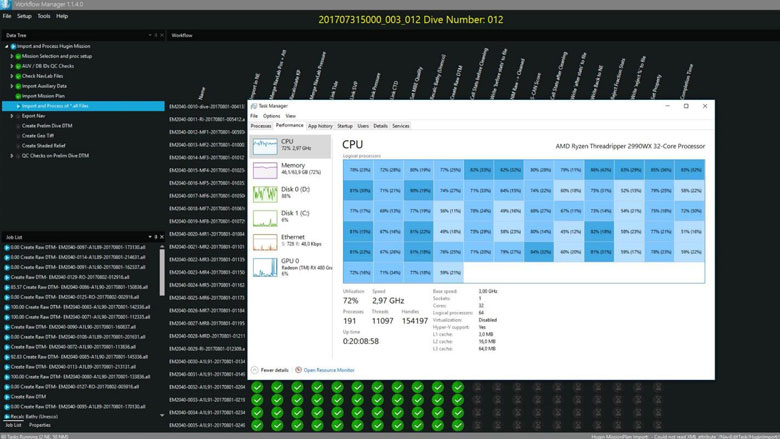
Execute multiple parallel NaviEdit, NaviModel and 3rd party commands
The more CPU (cores), memory and disk speed you have – the better you utilise the workflow engine. The optimal solution is running a bit fewer processes than the number of cores.
-
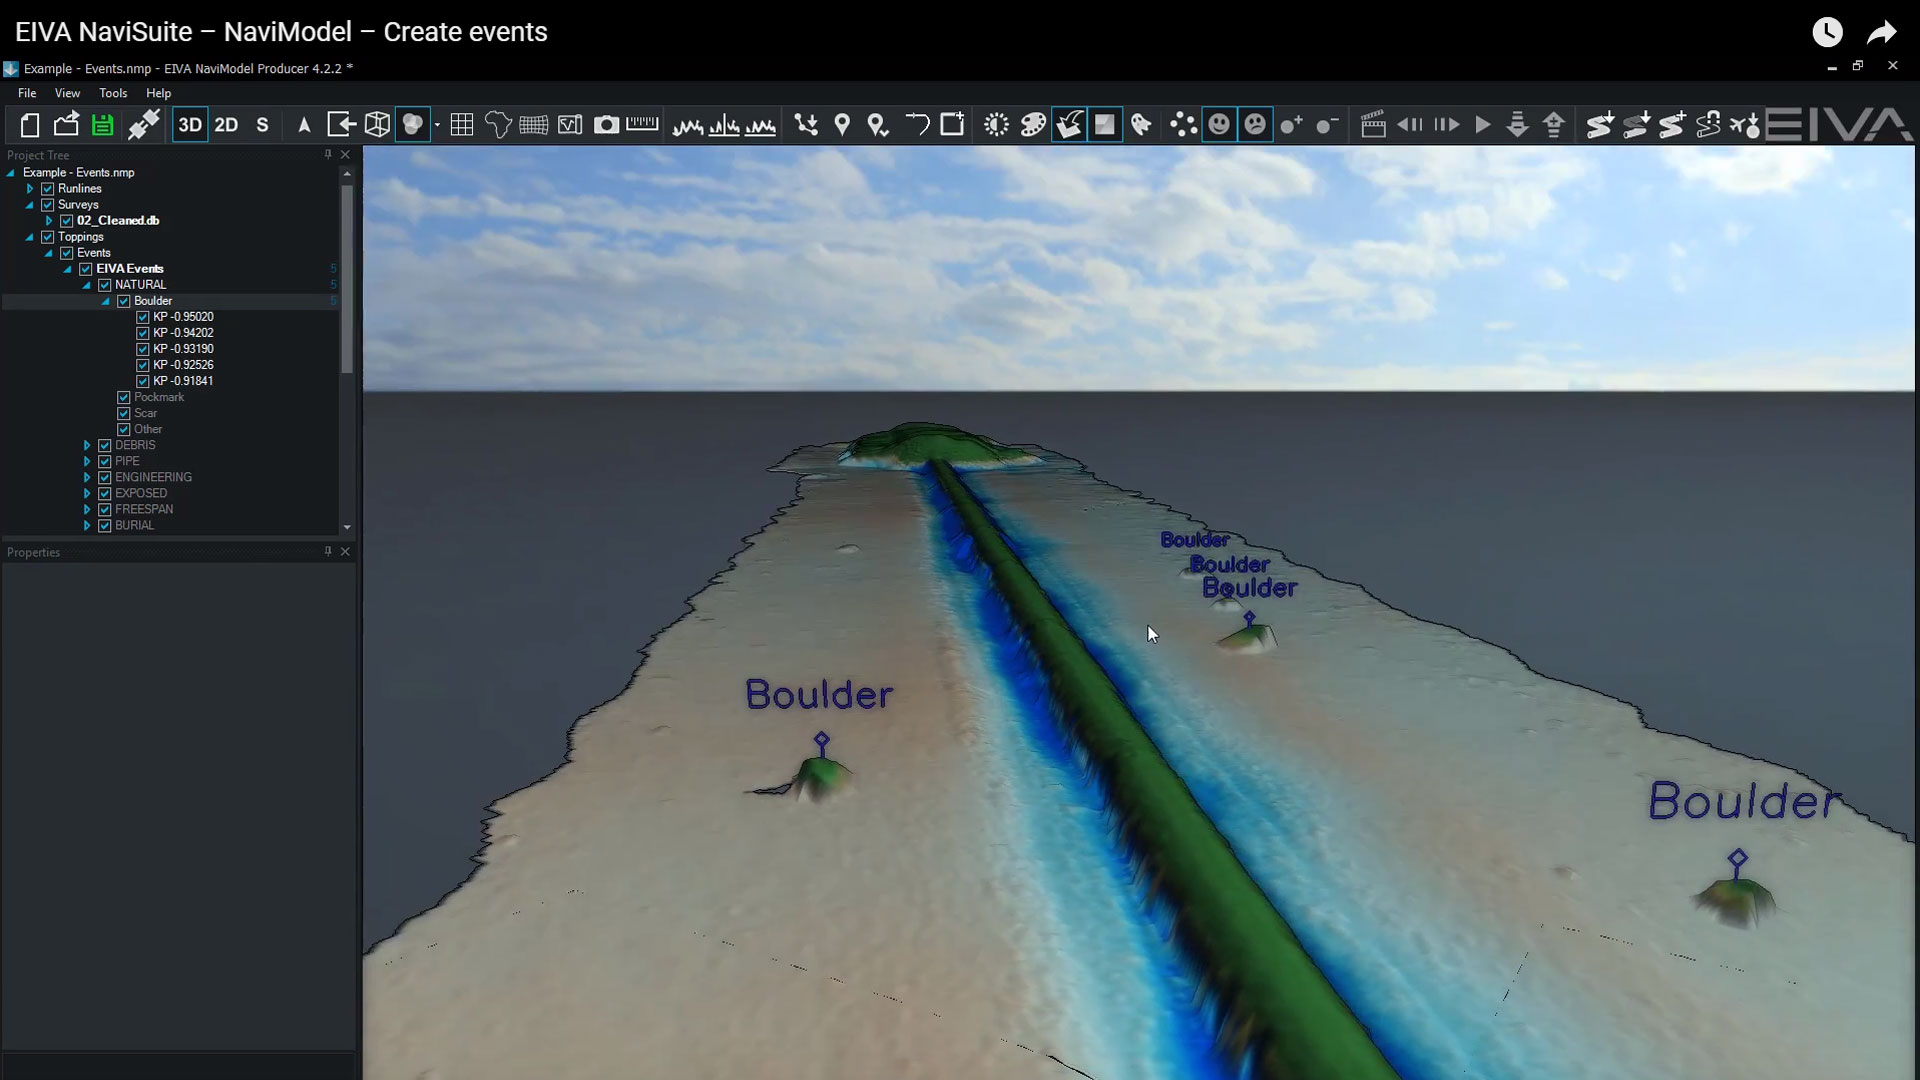
Eventing
The many eventing features include auto-calculation of event types and an easy-to-use event tablet view.
Eventing features
The many eventing features include auto-calculation of event types and an easy-to-use event tablet view.
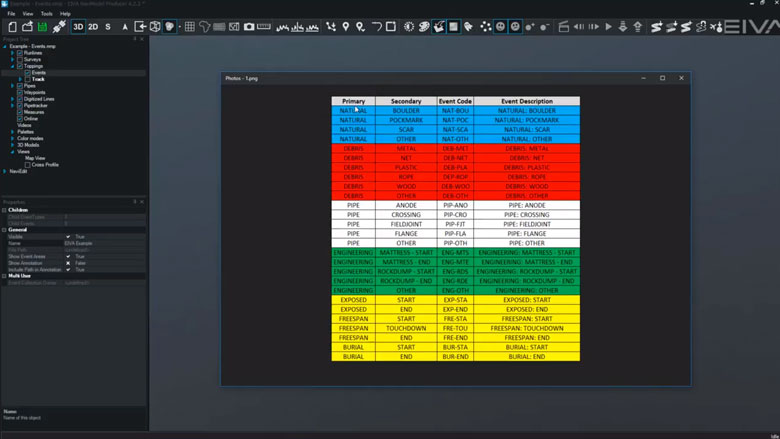
Configurable event types, hierarchy, and properties
Client and company specific event collections can be tailored to the activity undertaken.
During EIVA Days Denmark 2018, we presented a major expansion to the functionality of camera based scanning.
Create events
Events can be created quickly and are automatically placed onto a DTM.
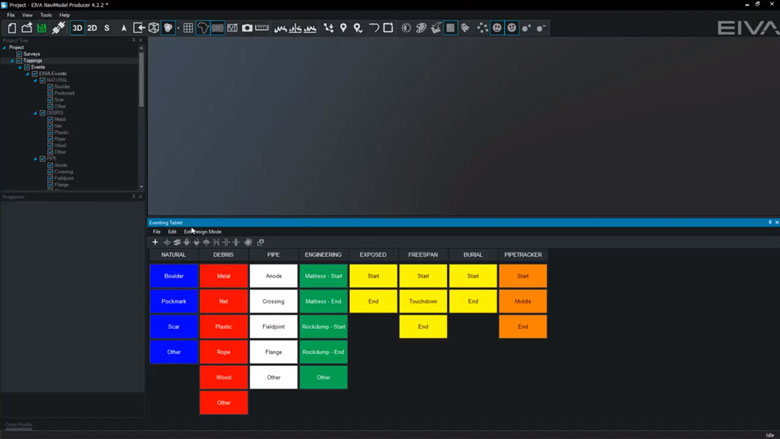
Tablet for fast event creation
Using the eventing tablet view allows for quicker event creation. With the eventing tablet, you can quickly add all events, or customise which events to add with just a few steps.
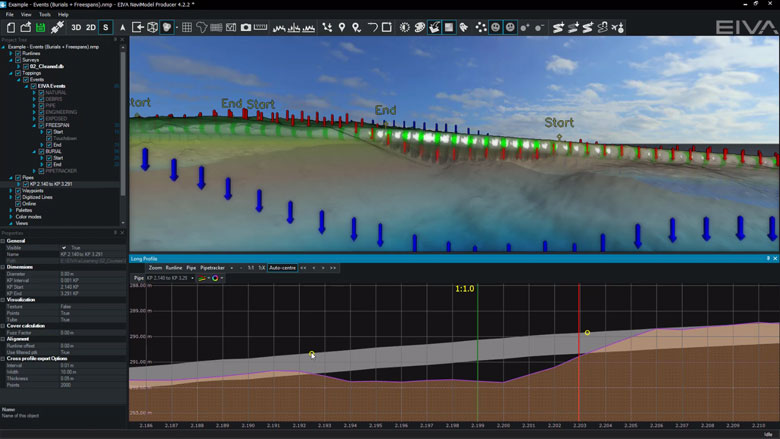
Create freespan and burial events
Pipe and seabed markers are used to create freespan and burial events.
This means that events and seabed markers always tie-in.
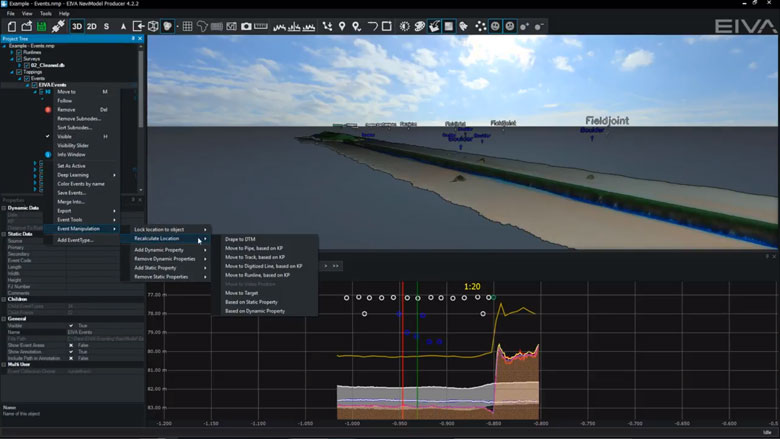
Recalculate events
Events can be recalculated at any time.
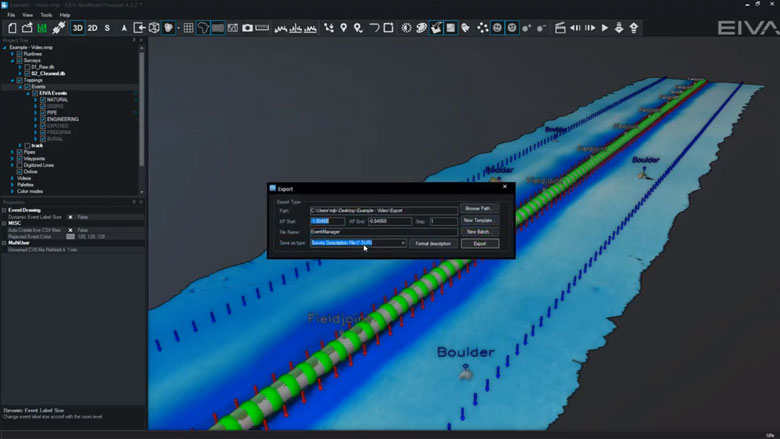
Export events
User configurable templates can be created to export events in the format required.
Export nearest image and videos
Images and videos can be exported for each event or for selected events.
Create pipetracker gap events
Pipetracker gap events are created from continuous sections of rejected pipetracker data.
You can also automatically identify and generate DTM gap events for quality control.
-
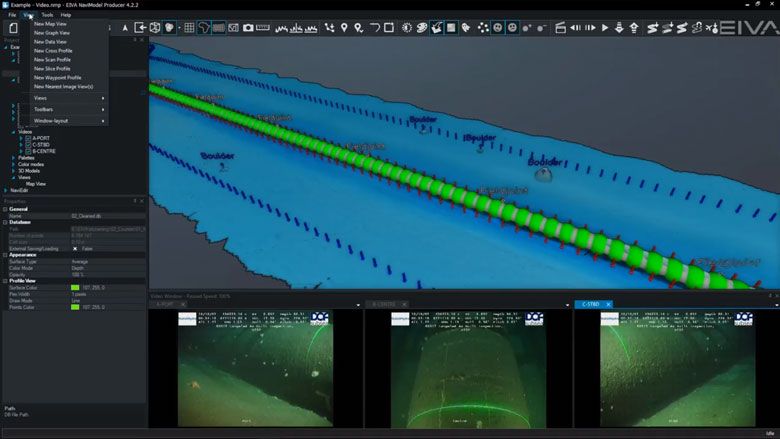
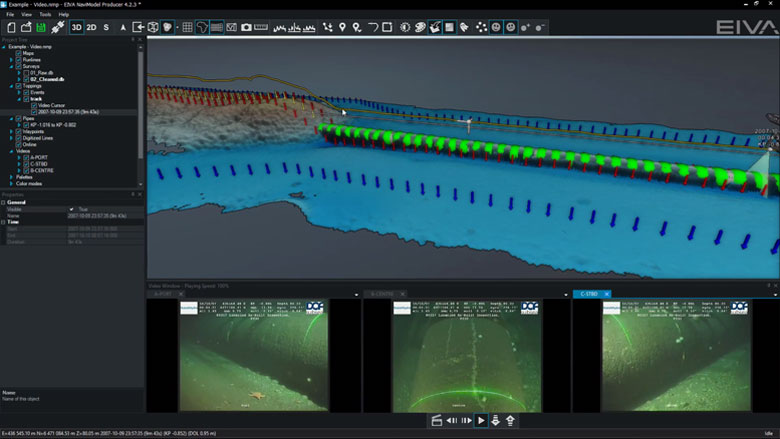
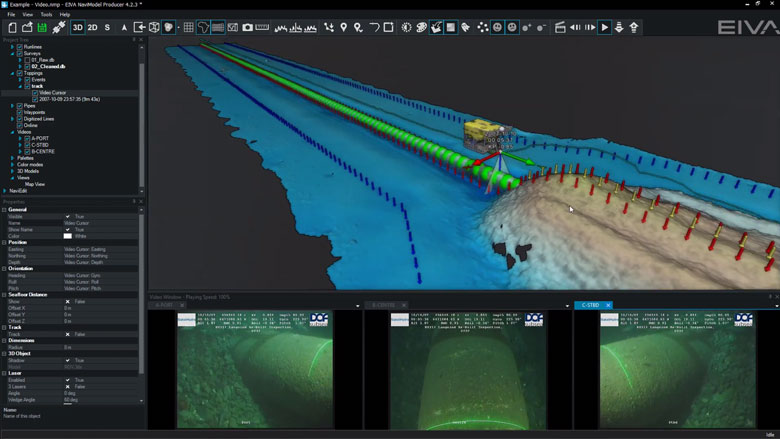
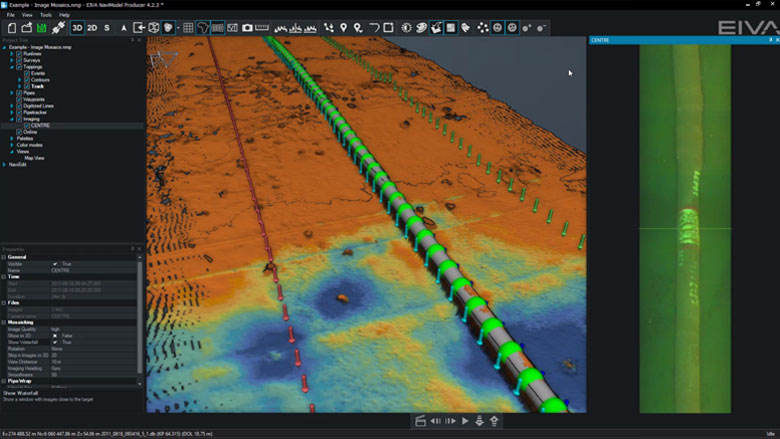
Videos and images
Video and still images that contain time stamps can be combined with other data sources in NaviModel.
Videos and images features
Video and still images that contain time stamps can be combined with other data sources in NaviModel.
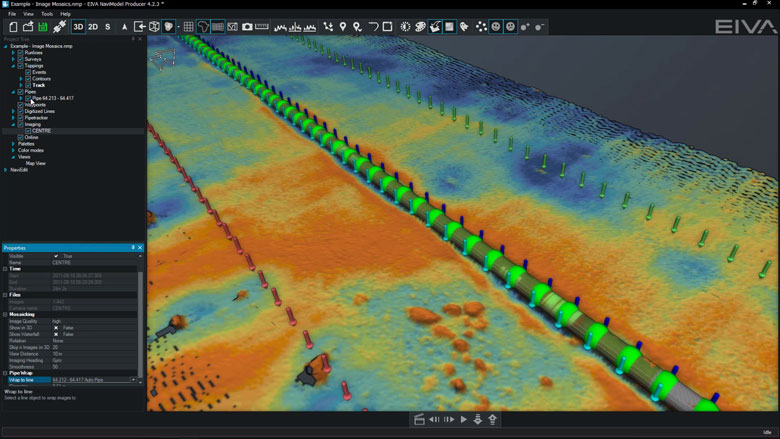
Drape images on digitised pipe
Video images can be wrapped around an existing pipe or digitised line in the Map View window.
Play and control video
Digital video acquired in external systems can be played and controlled inside NaviModel.
Synchronise video with track
In NaviModel the track contains the date and time and must be synchronised with the video time to enable videos to play.
Normally the video time and track time are recorded in the same time zone. However sometimes this is not the case and we need the option to change the video / track time so that video will play.
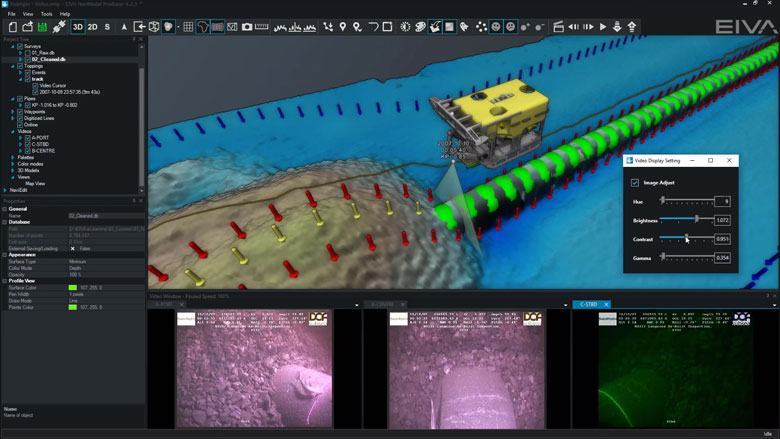
Adjust video hue, brightness, contrast and gamma levels
Hue, brightness, contrast and gamma levels can be adjusted to improve badly lit videos.
Display video images (Waterfall)
Video images can be displayed as a vertical waterfall.
-
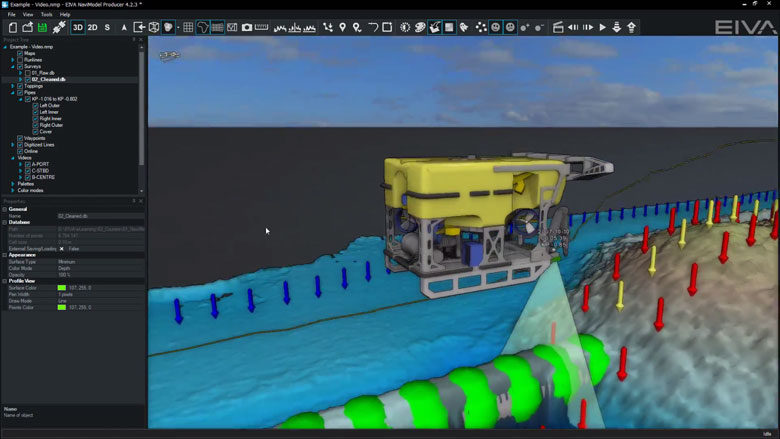
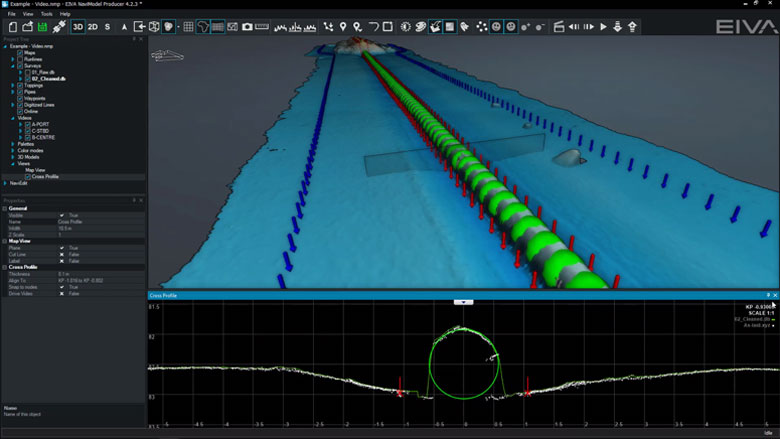
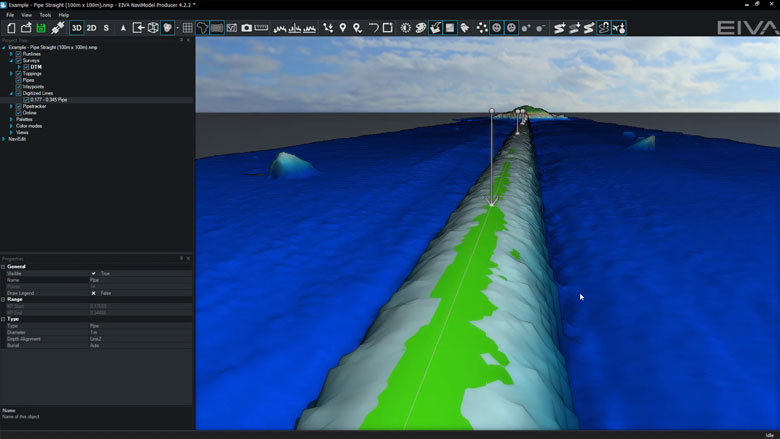
Pipeline tools
We have a great selection of manual and automatic tools, enabling users to quickly and easily identify the pipeline geometry from its surrounding environment. Pipe and seabed markers can be placed onto DTM surfaces or through data points.
Pipeline tool features
We have a great selection of manual and automatic tools, enabling users to quickly and easily identify the pipeline geometry from its surrounding environment. Pipe and seabed markers can be placed onto DTM surfaces or through data points.
Digitisation of pipe
Pipeline XYZ position can be manually detected by digitising the pipe marker.
Automatically detect pipe position
Pipeline XYZ position can be automatically detected.
Pipe-tracker integration and pipe-tracker statistical tools
The following pipetracker systems are supported:• Teledyne• Innovatum• OrionPipetracker systems assign quality flags to each pipetracker record. In NaviEdit the system flags can be used to de-spike pipetracker data.In NaviModel the raw and result pipetracker data can be visualised.Pipetracker data can be flagged as accepted or rejected in NaviModel over-ruling NaviEdit quality flags.
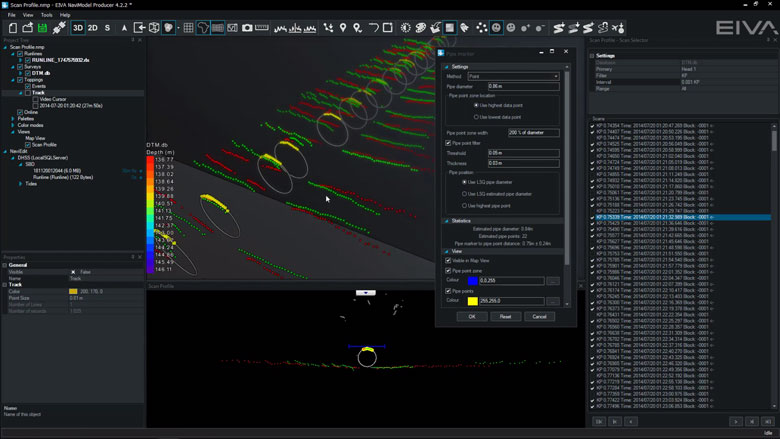
Scan-based pipe location
Scan Profile scans contain data points from matching port (red) and starboard (green) systems.
Scan profiles are normally created from acquired Dual Head Scanning Sonar (DHSS) data.
Once created, Scan Profiles can be used by the Profile Analyser.
Profile Analyser
Profile Analyser can be used on Scan Profiles or Slice Profiles.Profile Analyser places pipe and seabed markers through data points.Profile Analyser can create the following markers:• Pipe marker• Seabed markers• Trench markers
KP Axis view
KP Axis can be used to view and QC events.
Automatic freespan detection
Pipe and seabed markers are used to create freespan and burial events.
This means that events and seabed markers always tie-in.
-
Cable lay and planning
NaviSuite Beka has advanced functions for both the planning phase and construction phase of cable lay operations.
Cable lay and planning features
NaviSuite Beka has advanced functions for both the planning phase and construction phase of cable lay operations.
Cable route design with bending and slope constraints and cable route vessel placement verification
NaviModel includes a general planning tool for cable and flexible pipe routes. Based on the initial route (imported or drawn), the cable route will be placed on the seabed using the cable characteristics. Operators can then modify the route and in real-time see free-span, side-slopes and curvature. When the final route has been accepted, the system calculates and simulates vessel track using standard catenary data models.
-
Optional extra services and special offers
EIVA offers a number of services for our NaviSuite software users.
Optional extra services and special offers
Get the most out of your software
EIVA offers a number of services for our NaviSuite software users. These include:
- Access to our self-service licence administration and purchase portal, My EIVA
- eLearning, virtual and classroom training
- Software maintenance and 24/7 support programme (Comes free of charge for subscription licences – Learn about the different licence types and the maintenance and support programme)
- Custom development
- Mobilisation/installation – on-site or remote assistance
- Dongle replacement programme for lost or broken dongles for permanent licences
Also, we have a number of special offers:
-
References
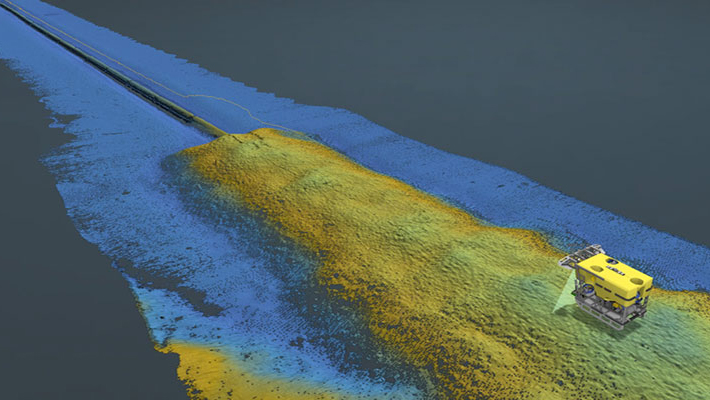
NaviModel offers high-performance digital terrain models in 2D and 3D and high-tech tools for model analyses and manipulations.
NaviModel references
TESSEC
'Ultra-shallow water positioning for stationary scanners is fairly complex and unprecise, especially when operating in a noisy environment such as a busy access channel and shipyard area. When positioning data is unavailable, EIVA’s NaviSuite software provided tools that guaranteed a difficult process was made easy and intuitive, enabling real-time analysis of data collected just a few hours earlier.'Technical Director Thomaz TesslerTESSEC Engineering and Maritime ServicesAkerBP
'A great thing about NaviModel is that you can drop big terrain models in no problem. In projects where we have data sets that range from 1 week to 20 years old they can all be dropped in, and form a patchwork of terrain models, which is really helpful and provides huge benefits’Operations Surveyor Matt CowingAkerBPMaridive Offshore Projects
'The EIVA NaviModel tools for cleaning bathymetric data have been and remain the most powerful and rapid tools available.'Mohamed Hashem, Offshore Survey Dep. Manager at Maridive Offshore Projects, NaviSuite user for 15 yearsStyvehavn AS
'NaviSuite Kuda is really an important component for us to be able to deliver these inspection services. Particularly NaviModel, which is a modern, fantastic tool to work with. It can display many kinds of data in 3D and allows us to prepare and deliver state of the art survey data to our clients.'General Manager Henrik Halvorsen'NaviModel is my go-to solution both for planning and processing. It's stable, reliable, and lets you process huge amounts of data seamlessly (even on PCs that are not so sharp anymore). It also reduces the time you spend processing.'
Umberto Guardascione, hydrographic surveyorFirst Marine Solutions
'When we were assessing what software package to go with, EIVA a/s was a clear choice. It is able to undertake any hydrographic survey operation, both traditionally or remotely. Utilising NaviModel for our client deliverables supports everything we are striving to achieve here at FMS Survey.'
Survey and Positioning Manager Carl Lafferty

Variant comparison
Related products
-
Workflow Manager – Server
Configurable workflow process automation tool allowing for automation of the small steps you normally go through when processing subsea data.
€ 13,650.00/year -
NaviModel Analyser
Basic processing, visualisation and analysis of data in 2D, 3D and 4D.
€ 26.00/day€ 1,592.00/year€ 4,775.00/permanent -
3D pipe option for NaviModel Producer
Efficient, model- and scan-based pipeline and cable route inspection, eventing and editing carried out with ROVs, ROTVs, AUVs and vessels.
€ 44.00/day€ 2,733.00/year€ 8,200.00/permanent -
NaviSuite Nardoa
Advanced 3D pipeline & cable route inspection software for data acquisition and processing.
€ 291.00/day€ 17,983.00/year€ 53,950.00/permanent -
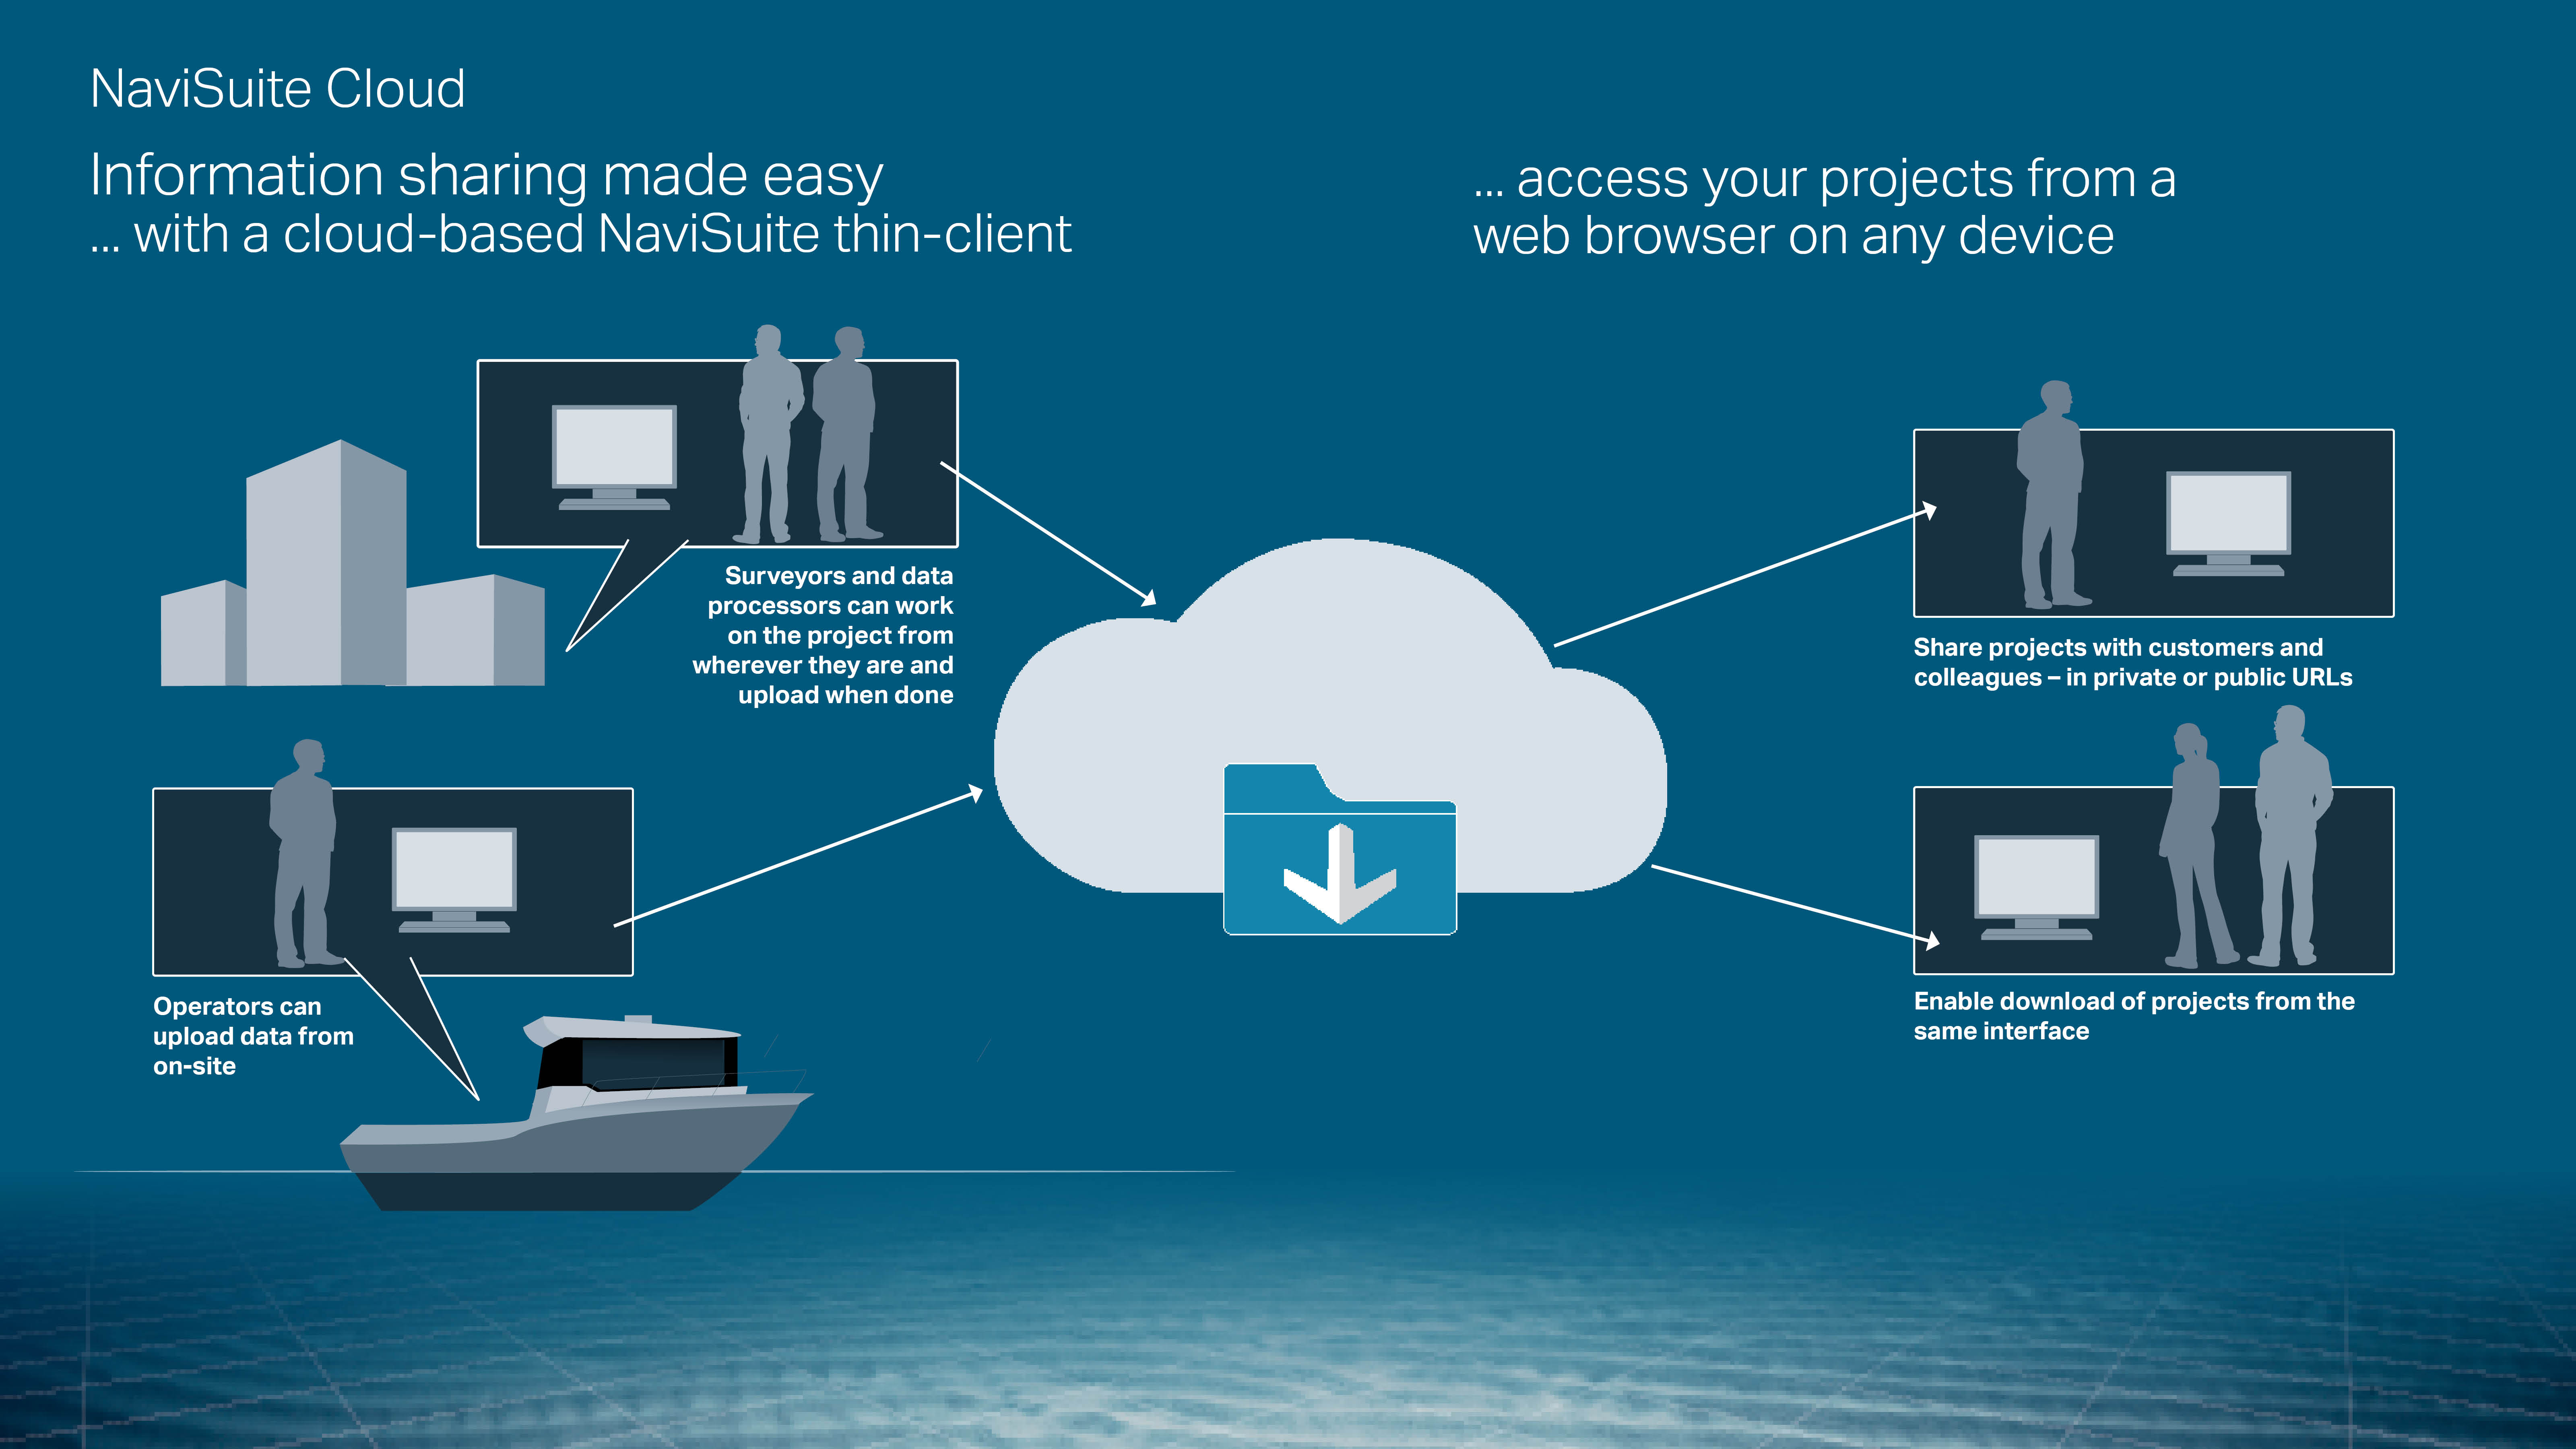
NaviSuite Cloud Viewer – 50 GB
Cloud-based thin client for sharing and viewing NaviSuite survey and inspection projects – Navigate 3D visualisations from a web browser – Share data easily and securely
€ 1,500.00/unit -
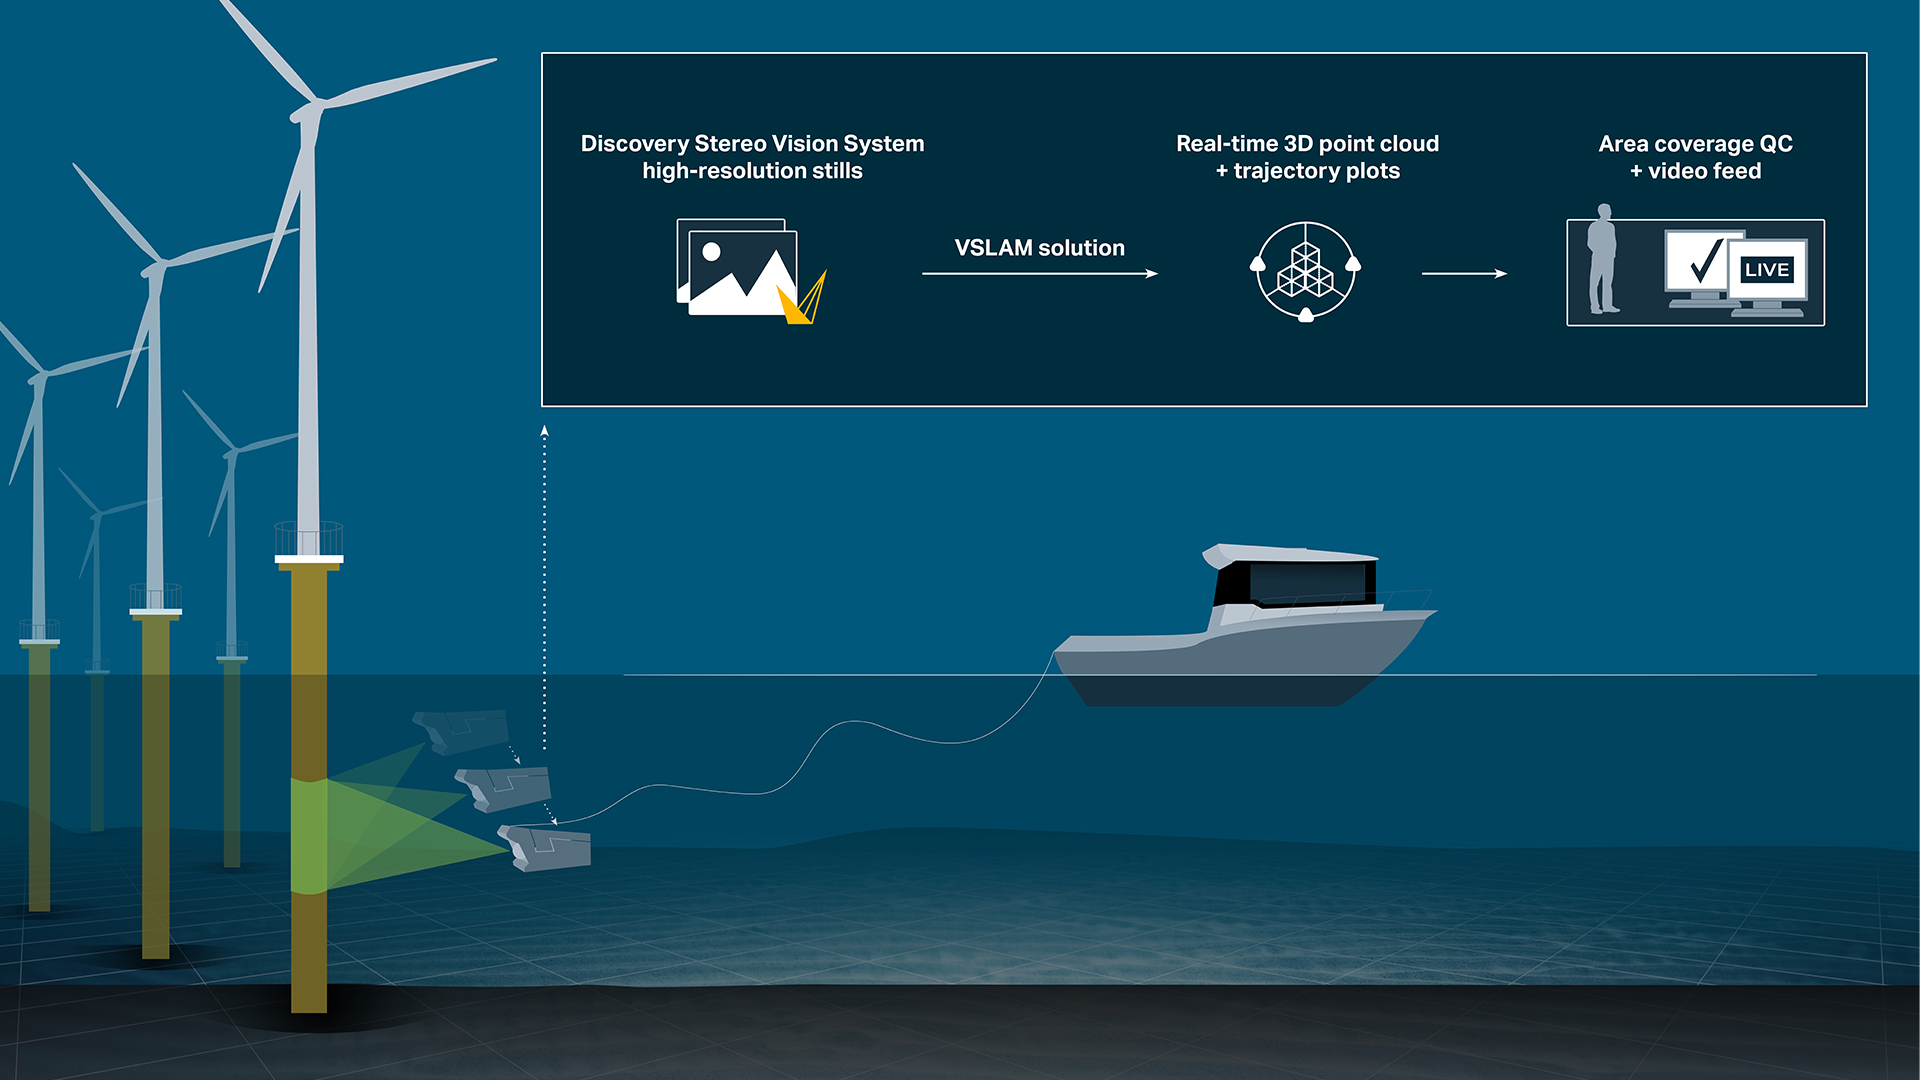
Voyis VSLAM Powered by EIVA NaviSuite
Comes standard with Voyis’ Discovery Stereo Camera – Real-time 3D point clouds & navigation trajectory plots – Area coverage & data quality control displays.