How EIVA modernised BP’s software solution for the quality control of survey data
The challenge of quality control in offshore operations
A common task of maritime survey and engineering professionals is to create a site overview that combines various types of 3D data. The objective is to provide a user-friendly interface between the user and the data, with options for visual representation in order to facilitate decision-making and project management.
BP previously worked with a variety of separate pieces of software for survey data QC, including applications for tidal forecasting, mooring catenary analysis and acoustic network adjustment. However, the modules were outdated and unsupported and did not provide the complete level of functionality required for modern data acquisition and processing techniques, such as 3D point cloud visualisation. BP were eager to develop a new solution, with efficiency, cost reduction, and modernising at the forefront of the project. They were seeking a solution that contained all the functions they required in an all-in-one package.
A software solution with many applications across the energy industry
BP’s engagement with EIVA stemmed from part of a tender process to find a vendor able to deliver a solution to the company’s specification. The outcome was the NaviSuite QC Toolbox.
The QC Toolbox enables users to visualise, analyse and quality control large, complex survey datasets. Developed in collaboration with BP, the QC Toolbox consolidates functionality from EIVA’s software packages: NaviEdit Pro, NaviModel Analyser and catenary option, alongside several new features. These include tidal predictions, network adjustments and P-format viewing. This solution has numerous applications for operators, client representatives, and geomatics professionals working across the marine and terrestrial sectors.
Since BP’s initial search for a new solution, technological development in the survey industry has moved faster than ever, with sensors generating ever increasing volumes of data. As a result, there is a growing requirement to collate, visualise, interpret and quality control spatial information within a single environment. This enables the maximum value to be extracted from data.
The results visualised in 3D
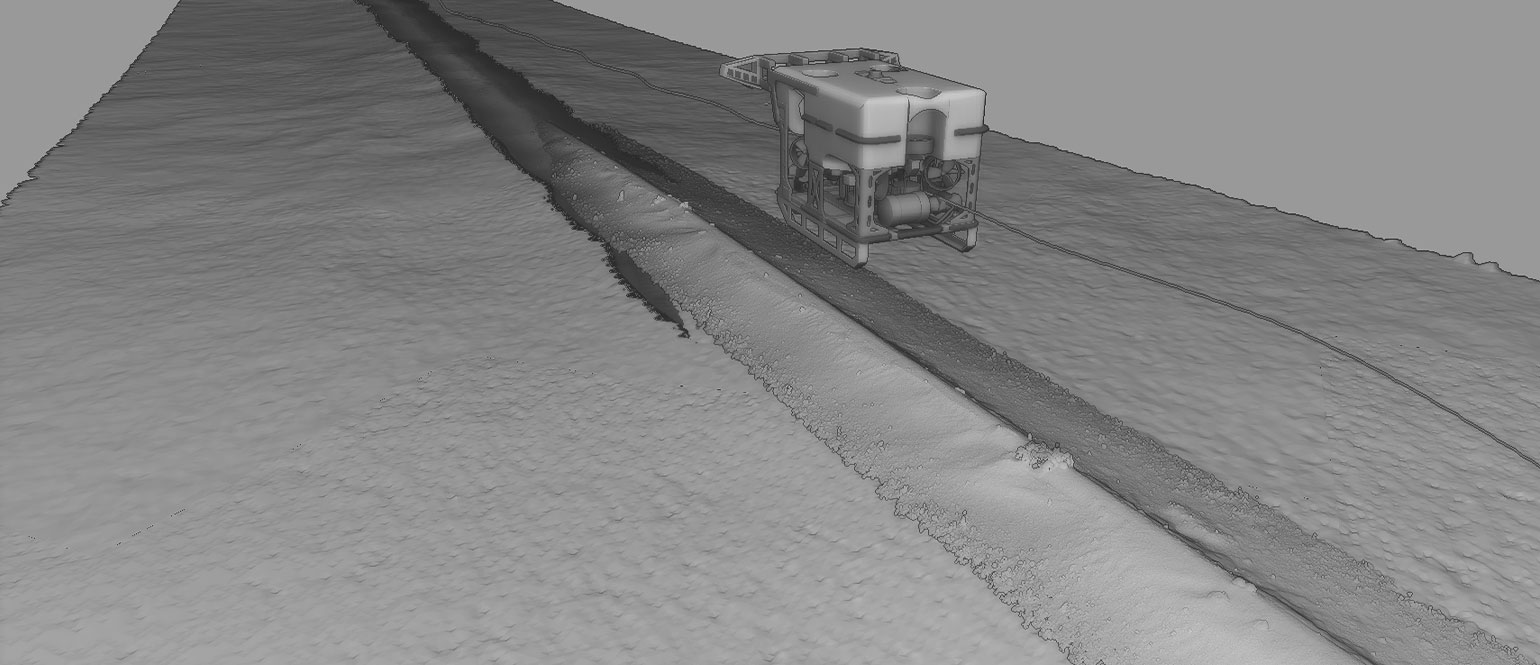
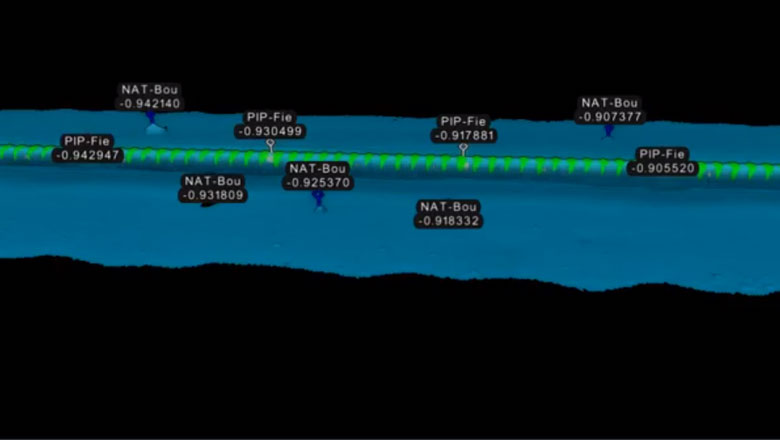
Examples of how the 3D features of the QC Toolbox are brought into play include the visualisation of out of straightness pipeline data in order to aid pipeline engineering analysis.
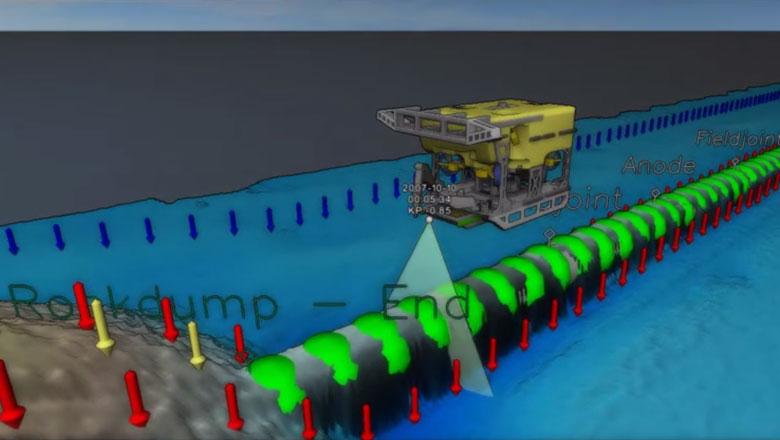
Visualisation of a pipeline inspection in NaviModel
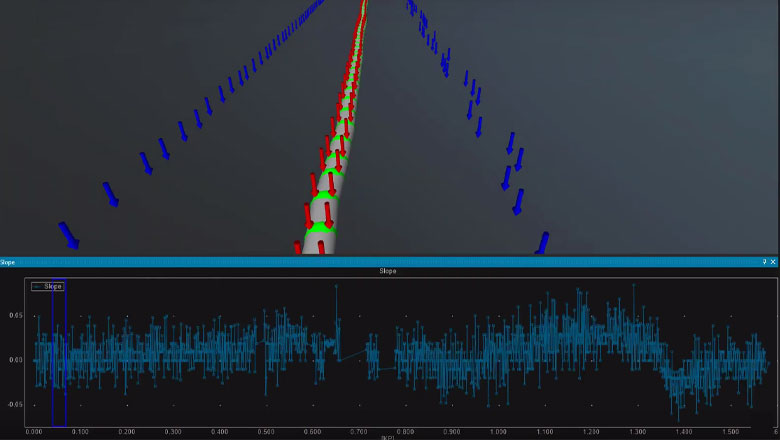
The analysis of a pipeline with statistical graphs in NaviModel
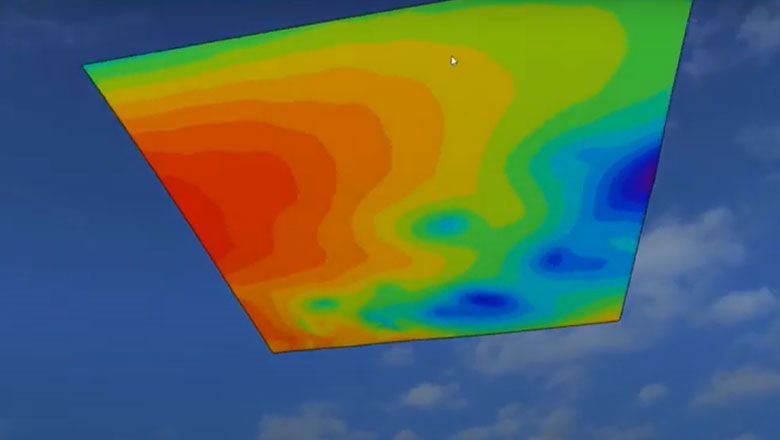
Combine multiple data sources within a single environment
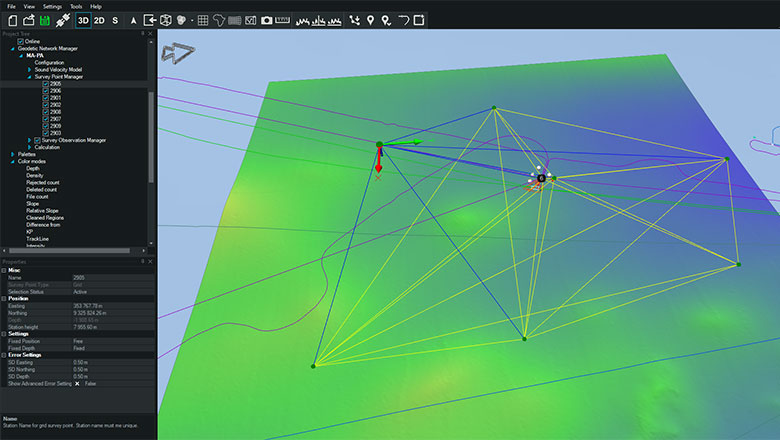
Undertake acoustic network adjustment and QC in NaviModel
Highlight events by creating user defined rules
‘Tidal prediction, catenary analysis, and network adjustment solutions have all been delivered. We anticipate that our survey representatives will be able to use this package in the field for QC while survey operations are ongoing, so it is not just for office-based project managers.’
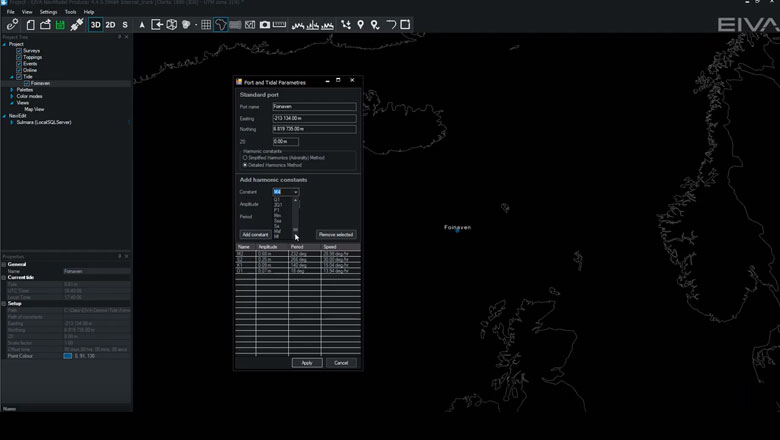
Create and check tide files
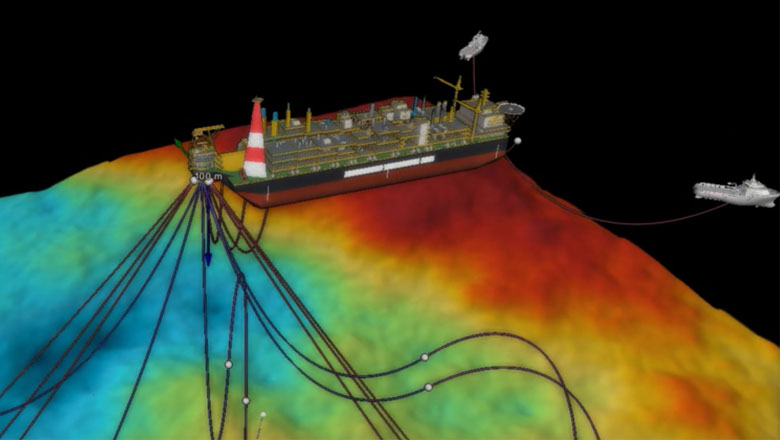
Visualise catenaries in a 3D environment
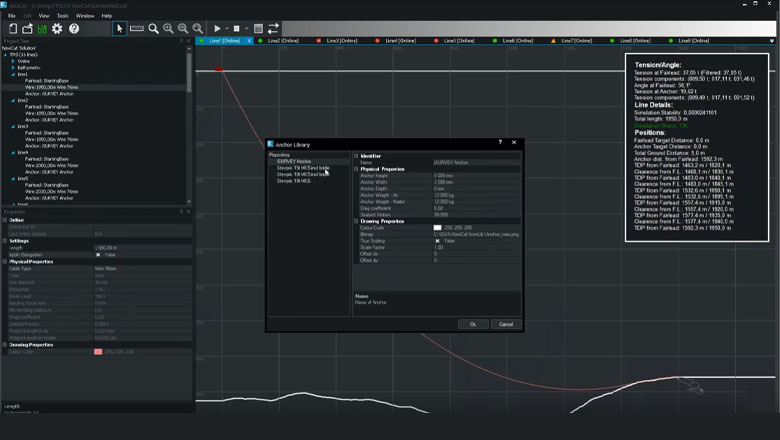
Catenary jewellery can be selected and checked from our built-in library
Products in play
NaviSuite QC Toolbox consists of:
Facts and figures
- BP operate in 70 countries worldwide with approximately 74,000 employees
- Positioning QC is critical within BP, with tolerances ranging from centimetric for construction and installation, to metre-level for mooring line clearance
- The QC Toolbox is utilised worldwide by BP for spatial quality control and assurance
Quality control of geospatial data:
- Multi-beam
- Laser
- 2D Seismic
- Linear asset positions
- Events
- Field layouts
- High resolution imagery
Independent quality checks on:
- Catenaries
- Acoustic metrologies
- Tidal predictions
- Site surveys
- Rig positioning and anchors
Want to know more?
We have created a NaviSuite QC Toolbox playlist on YouTube where you can watch many of its applications in action.