How a NaviSuite Academic Licence was used to assess the risks of a WWI wreck
In 2020, Aarhus University’s research vessel, AURORA, surveyed the sites of two wrecks which sank during WWI – one during the Battle of Jutland in 1916 and the other in 1917. These subsea surveys, along with surveys by teams from Germany, the Netherlands and other countries surrounding the battle site, were the first step of an EU Interregional research project, ‘North Sea Wrecks’.
The North Sea Wrecks project aims to improve the methods for risk assessment of wrecks in the North Sea in order to help with the sustainable management of North Sea ecosystems. Better risk assessment will provide safety benefits both for the environment and the industries active in these waters, for example recreational, fishing, shipping and energy.
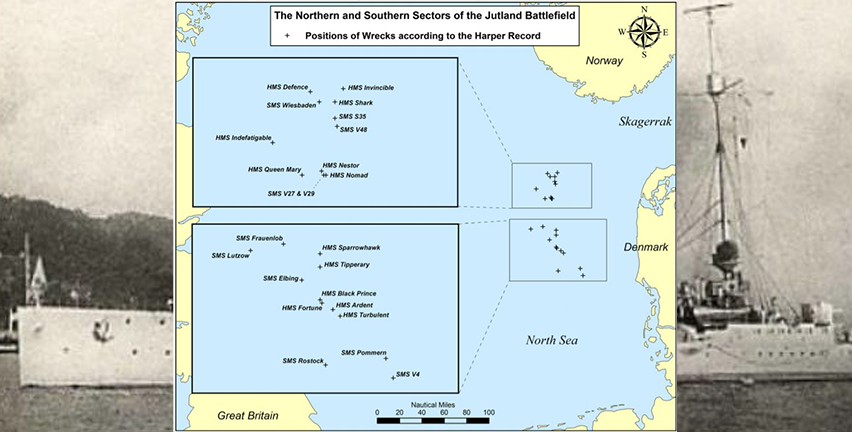
A map showing the positions of the wrecks from the battle of Jutland, courtesy of Dr Innes McCartney – combined with a photo of the SMS Elbing, courtesy of the ScapaFlow1919 site
A student rises to the challenge of identifying risks associated with the SMS Elbing
On the Danish team collecting data for the North Sea Wrecks project was Maria Hvidkjær Jensen, a Geophysics Master’s student who became hooked on processing geophysical data through this experience. For her thesis, she followed the data of one of the shipwrecks, the SMS Elbing, to the next step: processing and analysis.
In this article, we follow Hvidkjær’s journey to perform a risk analysis of the SMS Elbing using the data collected onboard AURORA. Along the way, she successfully processes and analyses multi-beam data using a wide variety of NaviSuite software tools.
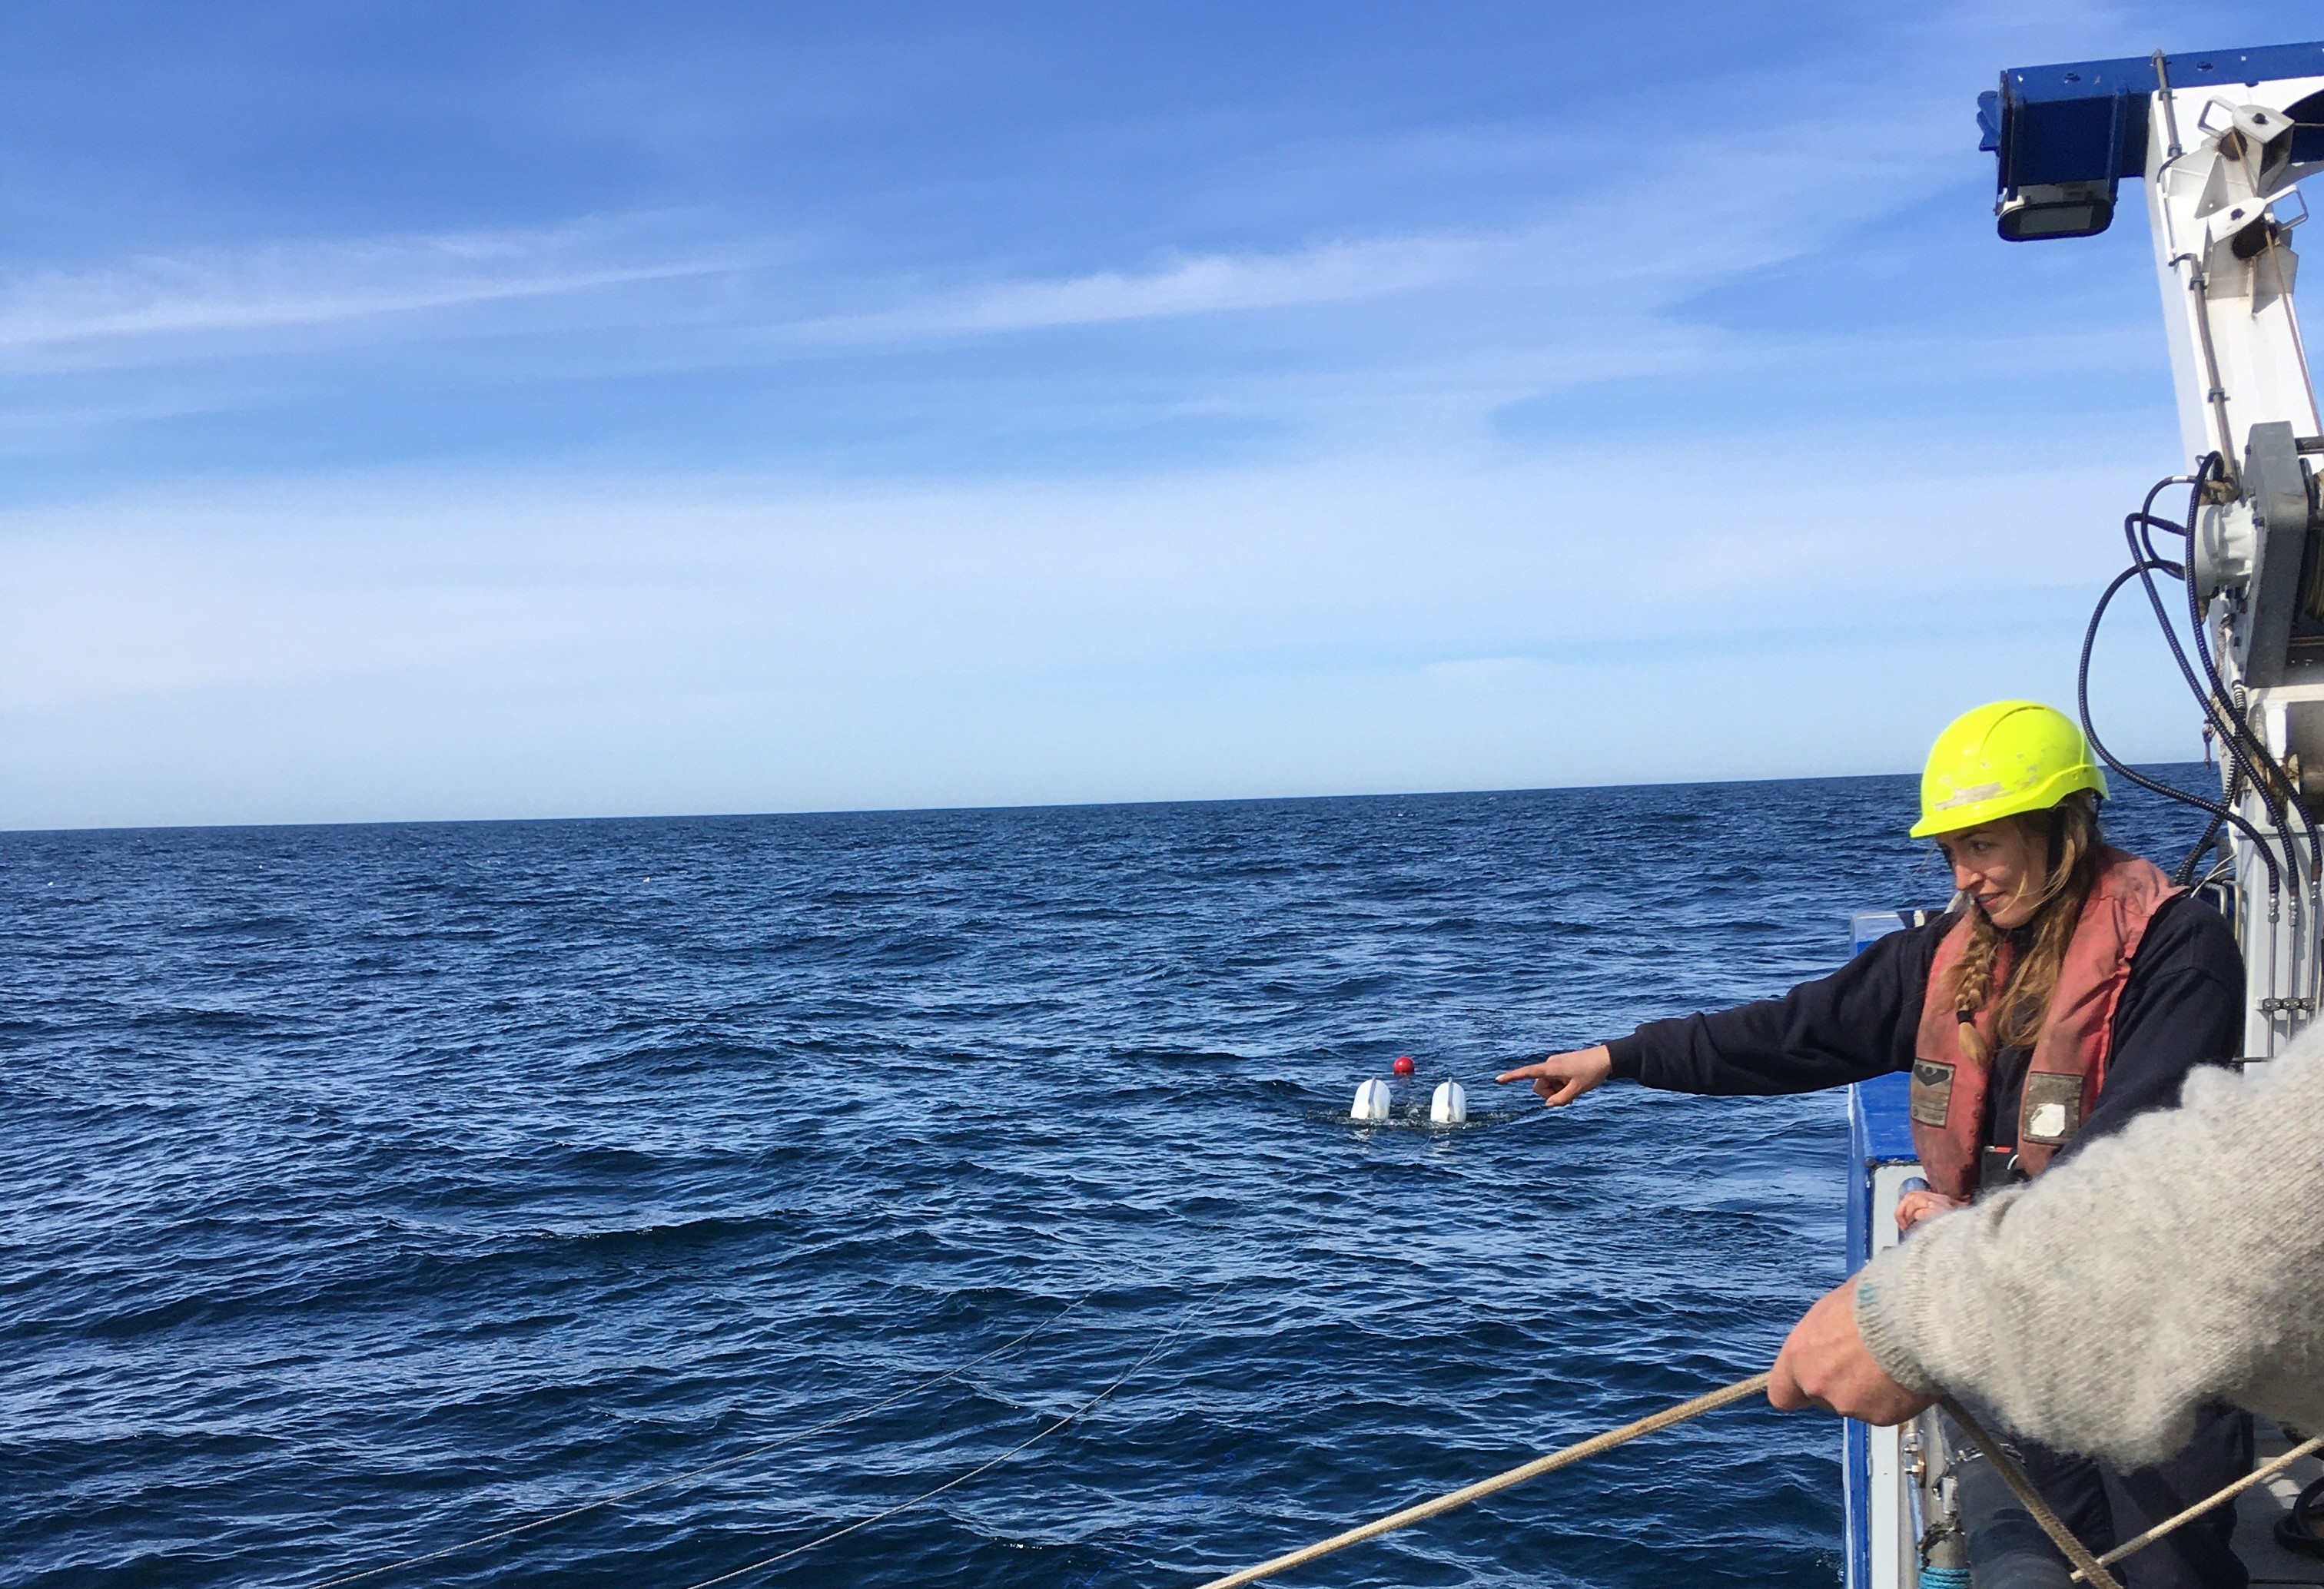
Onboard AURORA – image courtesy of Maria Hvidkjær Jensen
Hvidkjær chose this project for her thesis in part because it presented a ‘great opportunity to get experience using EIVA’s software’ with access to a free NaviSuite Academic Licence. She had already seen some of what the software could do onboard AURORA, where NaviPac and NaviScan are used for navigation and acquiring the multi-beam data.
EIVA provides Academic Licences to educational institutions as our way to contribute to the training of the future workforce of the maritime industry – as well as the advancement of maritime research. The licence includes our most extensive NaviSuite software package, a subscription to our eLearning site and 24/7 support for teachers.
Katrine Juul Andresen, Hvidkjær’s thesis supervisor, explained that Aarhus University uses their Academic Licences ‘to give students a taste of how we collect multi-beam data – if it catches their interest, they can then learn to use this advanced software in their projects and thereby gain an attractive skill to write on their CV’.
Learning the ropes while processing a NaviSuite solution
Armed with our suite of advanced software tools, Hvidkjær set out to study potential risk factors associated with the wreck of the SMS Elbing, including the conditions of the sea floor, the ship and its guns. To study these factors, she first processed the raw multi-beam echo sounder (MBE) data by using NaviEdit for survey data editing and NaviModel for advanced data visualisation.
New to the extensive ocean of NaviSuite software features, Hvidkjær learned as she went, leaning on the NaviSuite eLearning site to provide a guiding hand on the wheel. ‘I used NaviSuite eLearning both as a learning platform, but also as a place to search for inspiring best-practice examples and ways to improve my work using different approaches,’ Hvidkjær explained.
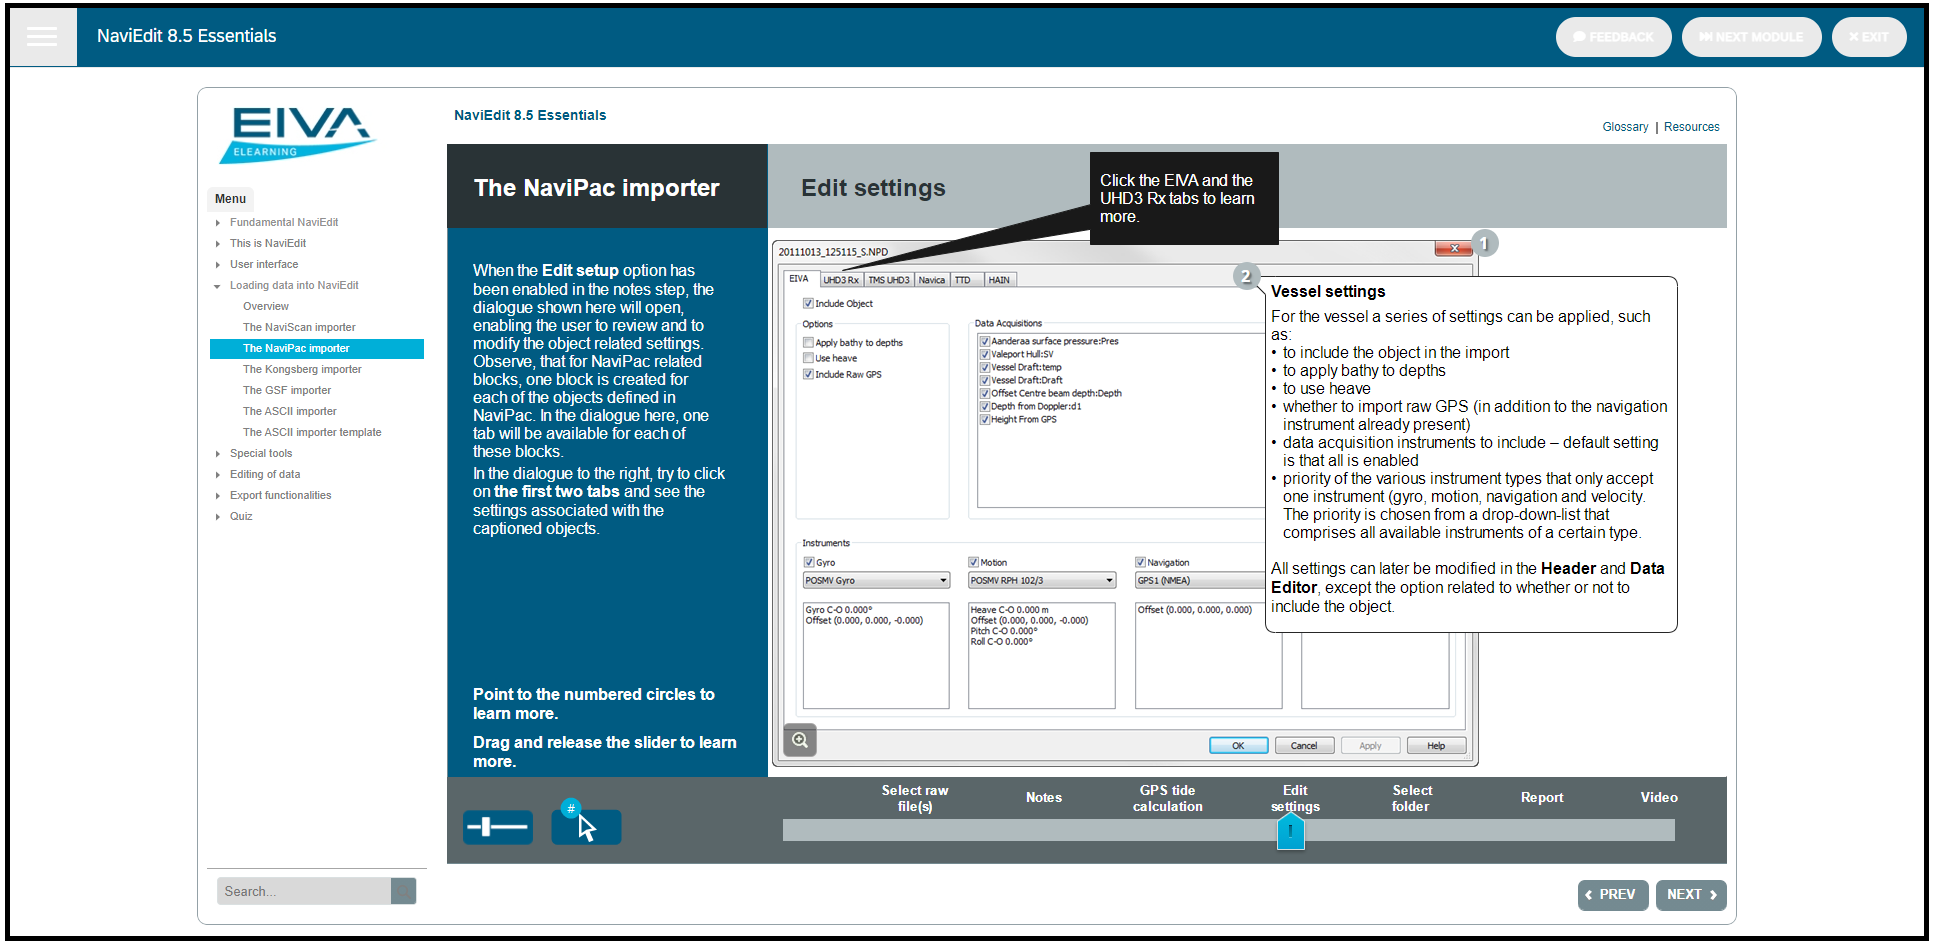
The EIVA eLearning site
This was for example how she found that the optimal way to correct the georeferencing and bathymetry was by running the two calculations simultaneously for each file. This correction was necessary because the setup of the survey lacked precise real-time kinematic (RTK) signalling and georeferencing.
This was a problem early on, and to find out what the problem was, Hvidkjær sent out an SOS in her network. An experienced NaviSuite user and instructor, Lars Dall, answered. ‘We had a virtual chat and Lars was great at explaining what the error could be – after which I could fix it and get past that obstacle’ Hvidkjær told us.
Note: If you can’t find a NaviSuite user in the sea of your network, feel free to make a post asking for advice in the EIVA User Group on LinkedIn. This group consists of a wide variety of NaviSuite users, both new to the software and experienced enough to have a black belt! You can also purchase 24/7 support from the EIVA team.
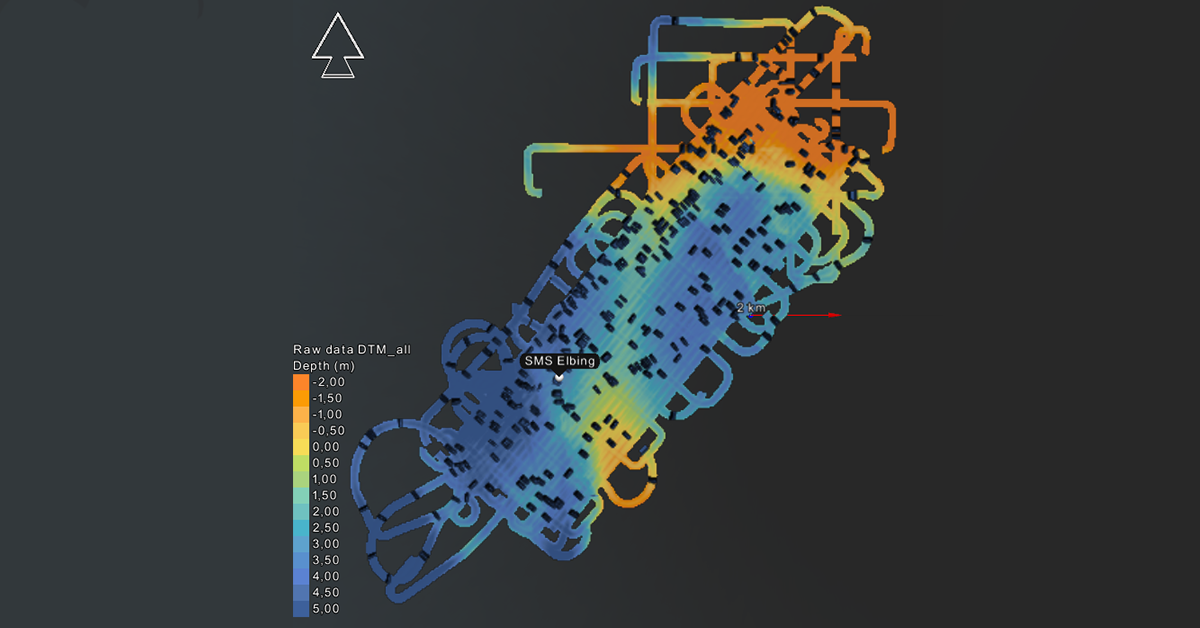
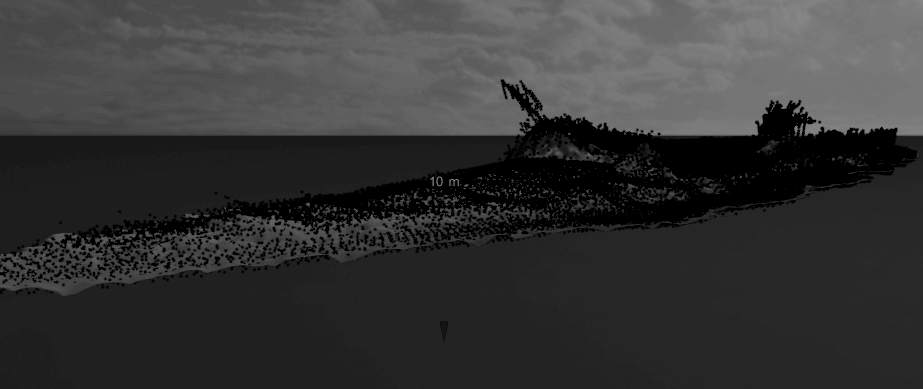
The raw MBE data loaded into NaviModel, where all the gaps from navigational dropout are present
Cleaning the way to a model
Once the raw data was loaded into NaviModel, Hvidkjær set about improving it, for example by deleting bad quality beams, correcting heave, deleting large gaps in the data and correcting tidal data. Then it was data cleaning time, for which NaviModel contains a variety of smart software tools. These include the Histogram Plane Cleaning tool, which Hvidkjær used.
This semi-automatic data-cleaning method calculates the positions of all points in a plane and represents the distribution of the numerical data range as a histogram. You can then use a slider to adjust the cut-off values on the histogram. When adjusting the slider, a preview of the resulting effect is immediately shown on the digital terrain map – red points being marked for deletion. So, you can easily check the results to make sure that only noise is to be deleted.

Example of histogram plane cleaning
The final risk assessment combined results from several models
To assess the risk level of the SMS Elbing, Hvidkjær analysed the data which she had processed, in the form of digital terrain models (DTM) combined with a variety of other types of data collected. Using these data to assess the ship’s condition and the area around it led Hvidkjær to conclude in her thesis that the SMS Elbing poses a medium risk.
One of the factors affecting the risk level is seabed changes around the wreck due to for instance erosion and deposition, and how fast such changes would be. Erosion could undermine and eventually dislocate the wreck, while deposition could bury the wreck. Both processes could influence the state of the wreck and could thereby potentially have dangerous effects, such as leaking munition or fuel, as well as triggering explosives.
The likelihood of changes in the seabed was investigated using models of the seabed around the shipwreck, while the risk associated with the changes was predicted based on a model of the shipwreck itself. Overall, there are 3 models, which we will explain how Hvidkjær analysed:
- DTM of the seabed in the area around the wreck, which was created using bathymetric data
- Map of the seabed type, which was created using backscatter data processed in NaviModel, as well as physical sediment samples
- DTM of the shipwreck combined with a point cloud of the shipwreck
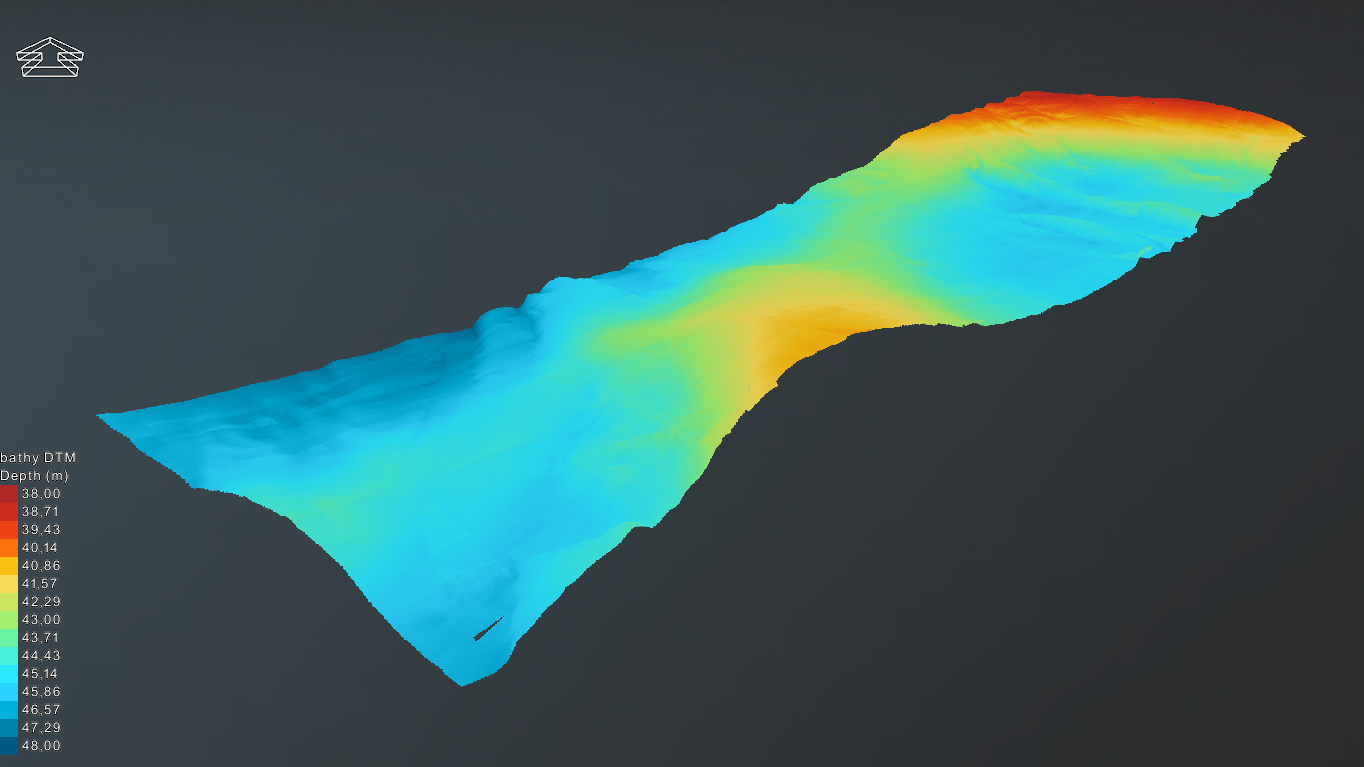
The DTM showing the surveyed area around the ship
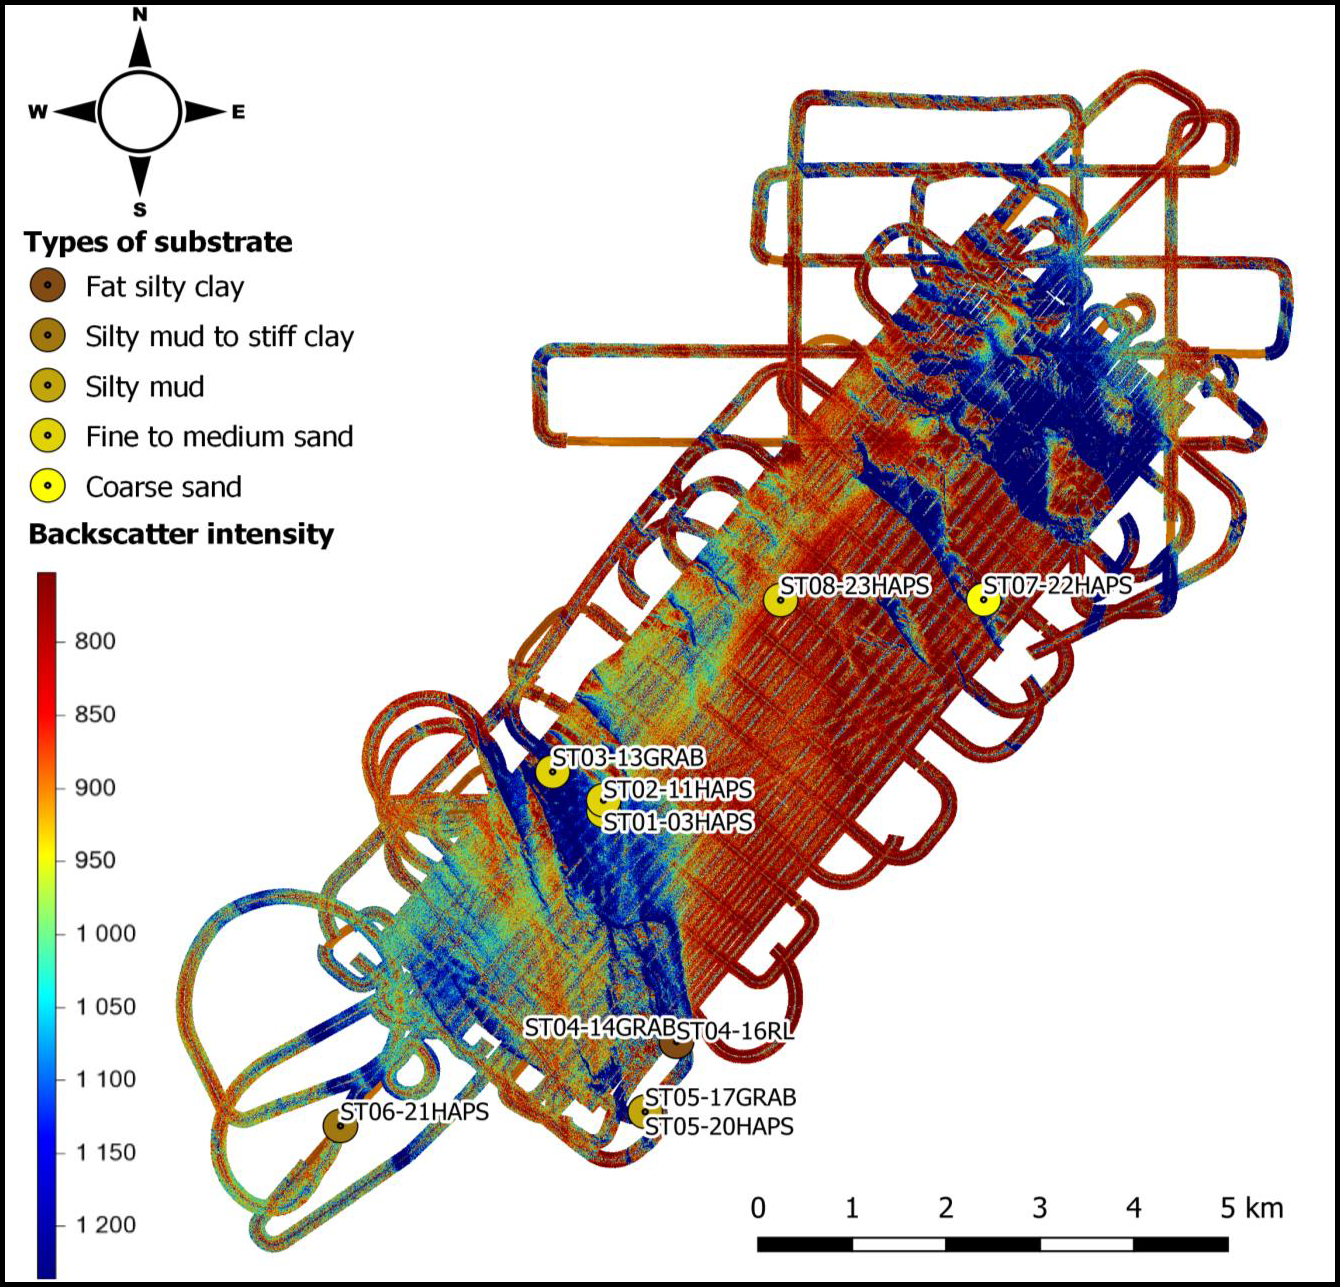
In QGIS, the backscatter map from NaviModel was combined with the physical sediment samples taken onboard AURORA
‘From the data, we can see that there is a mobile sand layer around the wreck, which can mean quite a bit of movement in the sea bed’ Hvidkjær explained – the mobile sand layer can for example be seen through the high backscatter values and the sediment samples.
Using a variety of NaviModel Analyser tools, Hvidkjær could quickly and effectively visualise the DTM in a variety of ways in order to analyse it. The tools she used included slope visualisation, profile views and length measurements.
By selecting the slope colour mode, she created a map which is coloured based on how steep the slope is. The slope map outlines the extent of morphological features, making it is possible to identify processing artefacts, exposed cable and the SMS Elbing, as well as the outlines of structures such as ridges. The profile tool can then be used for example to measure the distance between ridges.
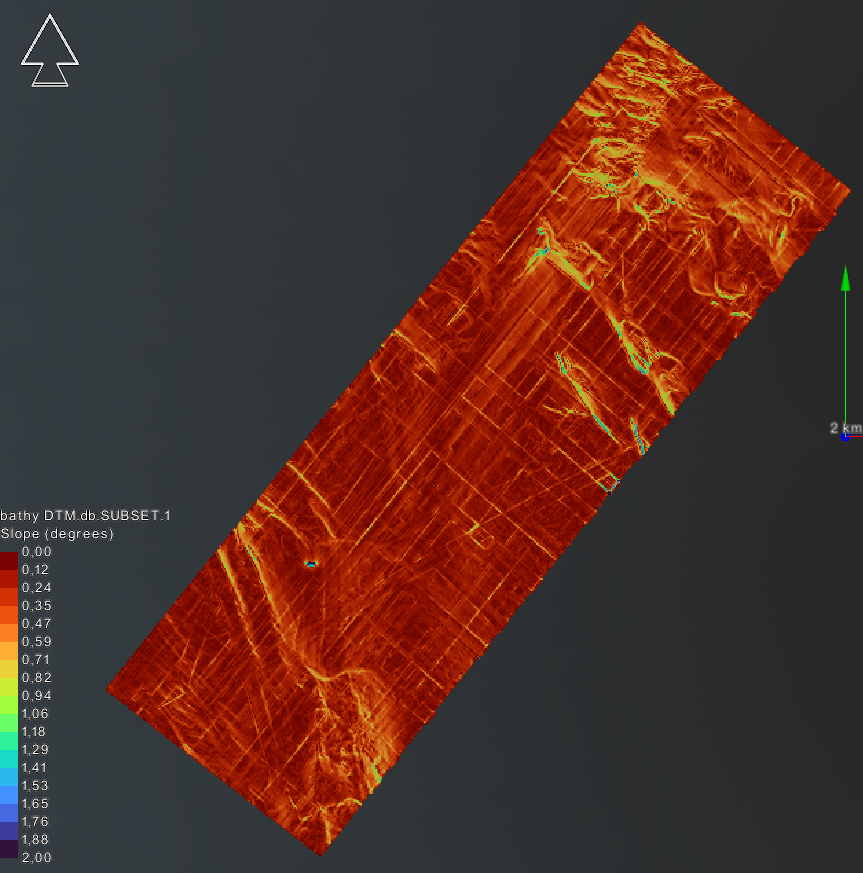
The DTM in NaviModel visualising slope
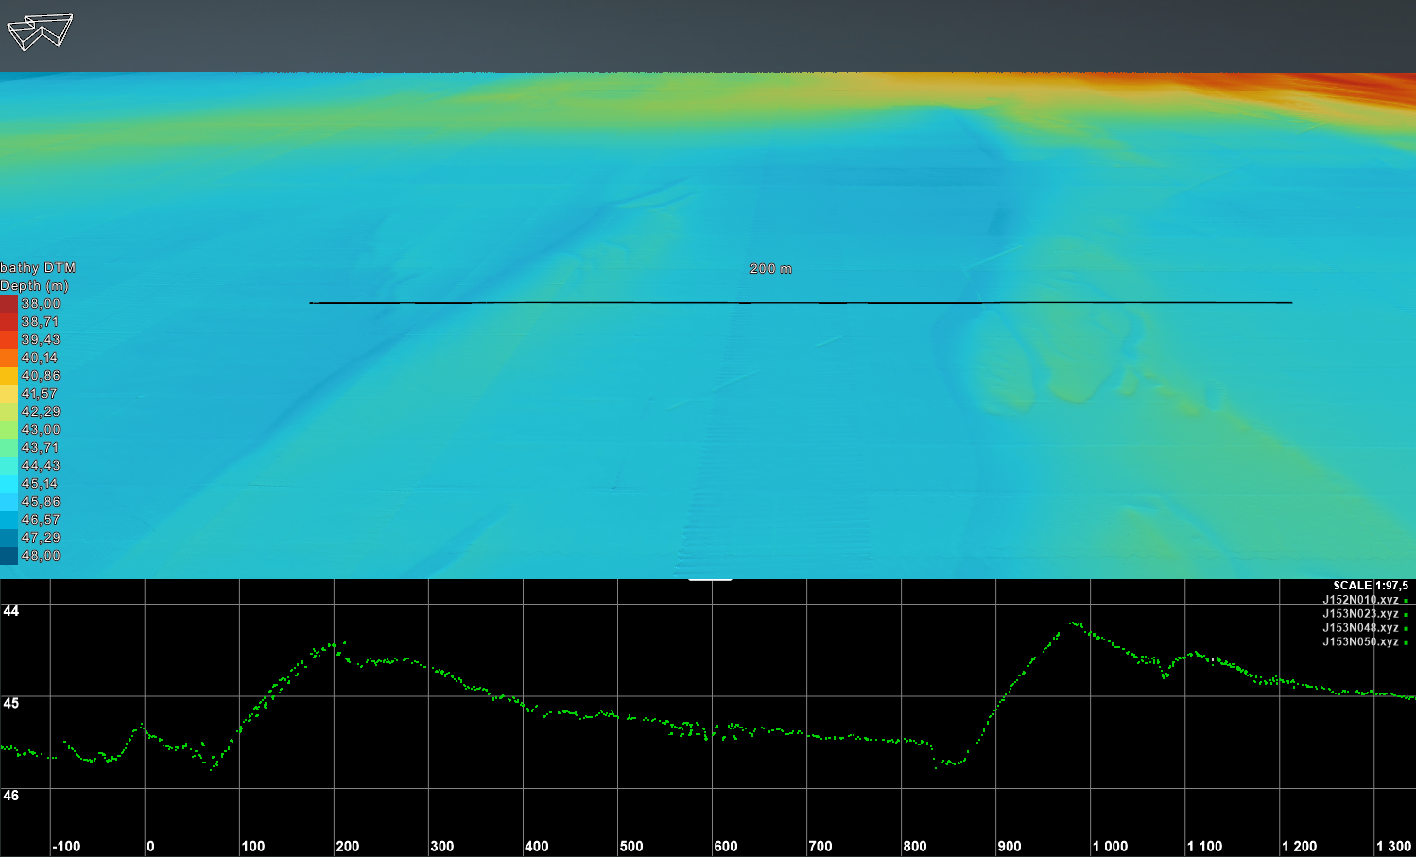
The profile tool in NaviModel – in the bottom, you can see the profile displayed as points on a chart for clarity
Another factor which contributed to the risk assessment was the current condition of the ship and its guns. Their condition was analysed using a model of the ship, which was created by combining the point cloud and DTM created from MBE data. One of the many advantages of NaviSuite software is the option to combine many types of models in one visualisation like this!
The dimensions of the modelled wreck were easily measured in NaviModel. These could then be compared to the original dimensions in order to estimate the level of deterioration of the SMS Elbing. With her analysis, Hvidkjær could conclude that the ship was in good shape for her age – over 100 years!
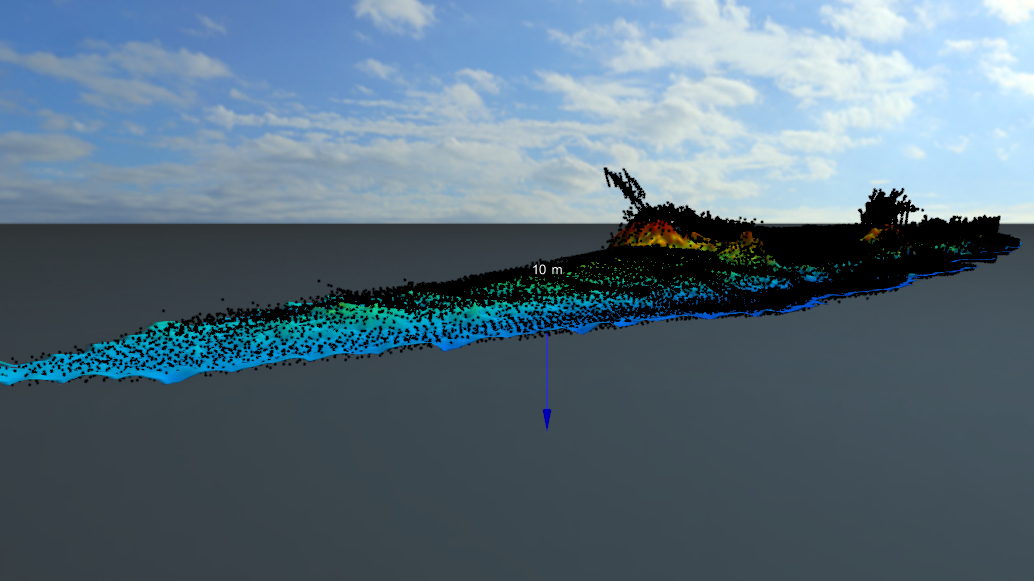
The hybrid model of the ship, with two guns protruding from it
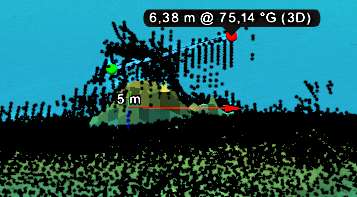
The measurement tool shows the expected gun length based on the hybrid model
The risk assessment data sails on in the next step
After Maria Hvidkjær Jensen graduated the journey continued for her risk assessment data in the North Sea Wrecks project. The goal of the project was to use the data on the potential risks of the SMS Elbing, as well as similar data collected on other wrecks in the North Sea, to develop risk assessment algorithms. Ideally, these algorithms can one day be implemented in an online tool with which one can easily check the risks of activities in a given area of the North Sea.
If this case has whetted your appetite for surveys of WWI wrecks, check out another maritime archaeology case study on how Dr Innes McCartney compiled an account of the Grand Scuttle of Scapa Flow using a NaviSuite Academic Licence.
Products in play
NaviEdit
Editing of overall survey settings, raw sensor data and geodetic settingsNaviModel
3D/4D modelling to process, combine, visualise and analyse subsea dataNaviSuite eLearning
Online platform for learning basic and advanced NaviSuite software toolsNaviSuite Academic Licence
Free software licence, eLearning subscription and support for educational institutions
Facts and figures
- SMS Elbing was thought to have scored the first hit of the battle of Jutland
- The multi-beam data was collected using NaviPac and NaviScan – along with a POS MV computer for the accurate GPS position and a SeaBat 7125 MBE
- The North Sea Wrecks project ran to October 2022