


Key features and benefits

Increased precision of data
Increase the precision level by adding the certified EIVA ATTU time-tagging unit as an optional extra.
Increased precision of data
... through the EIVA ATTU time-tagging unit
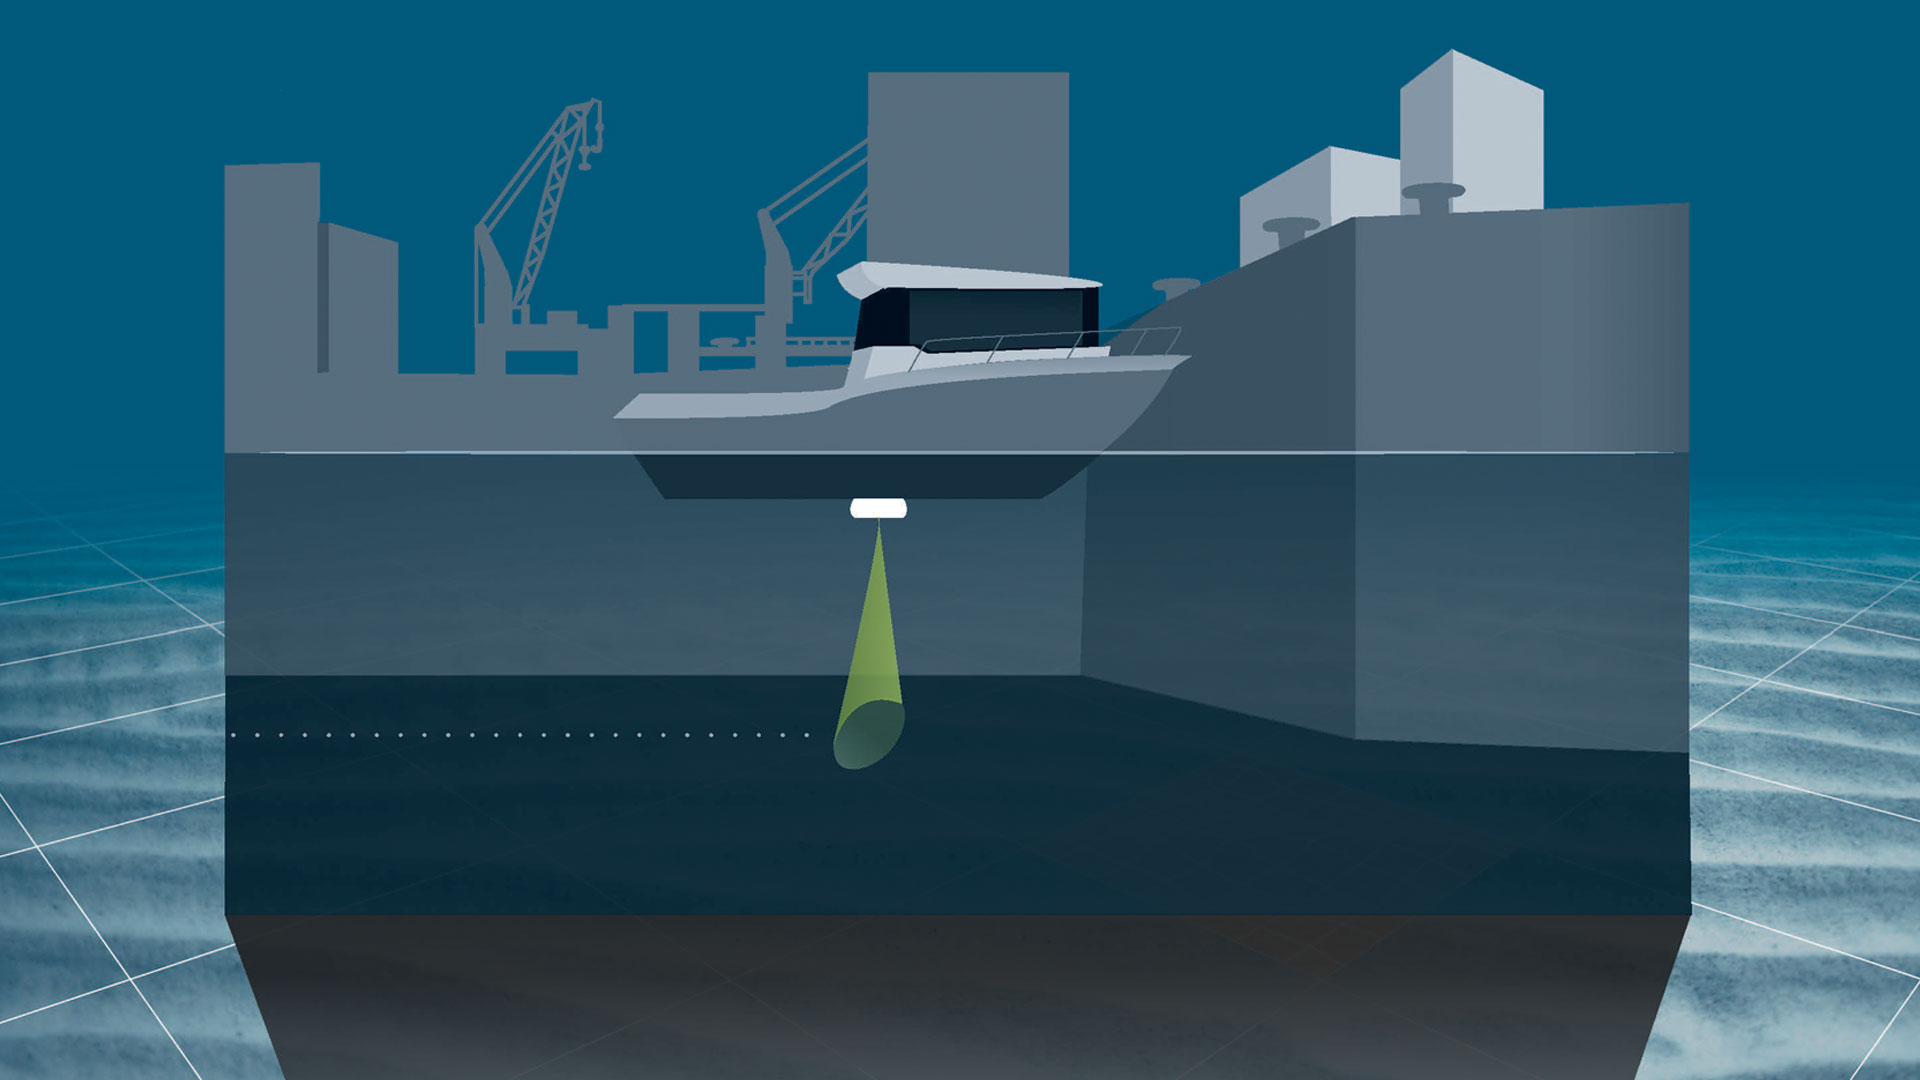
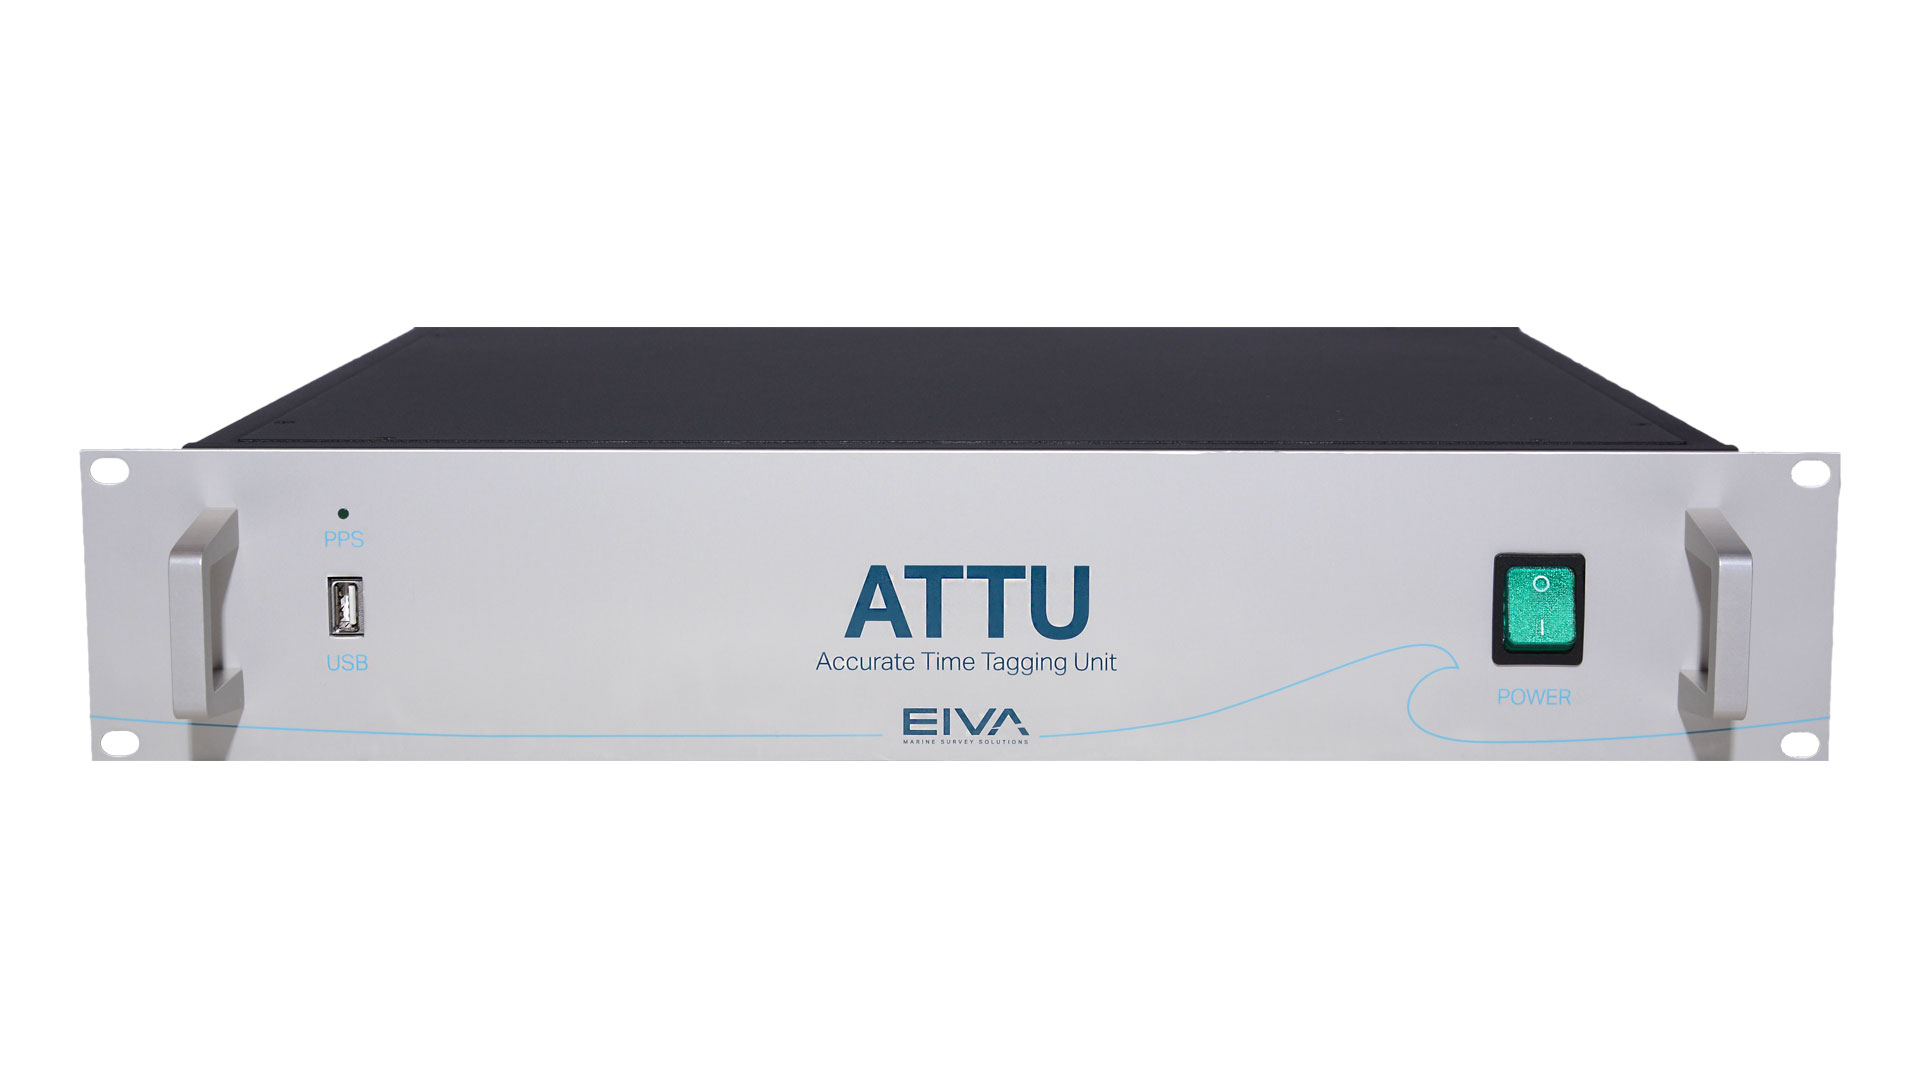
As NaviSuite Kuda supports standard vessel navigation equipment such as GPSs, motion reference units (MRUs) and INSs, you are ensured a high precision of your data – a very high precision, if desired, by adding the certified EIVA ATTU time-tagging unit as an optional extra to your NaviSuite Kuda setup. The EIVA ATTU offers a time-tagging accuracy better than 50 µSec, which is far superior to what can be obtained through the use of the standard clock of an ordinary computer.
The EIVA ATTU time-tagging unit
-
Optional extra services and special offers
EIVA offers a number of services for our NaviSuite software users.
Optional extra services and special offers
Get the most out of your software
EIVA offers a number of services for our NaviSuite software users. These include:
- Access to our self-service licence administration and purchase portal, My EIVA
- eLearning, virtual and classroom training
- Software maintenance and 24/7 support programme (Comes free of charge for subscription licences – Learn about the different licence types and the maintenance and support programme)
- Custom development
- Mobilisation/installation – on-site or remote assistance
- Dongle replacement programme for lost or broken dongles for permanent licences
Also, we have a number of special offers:
-
General visualisation tools
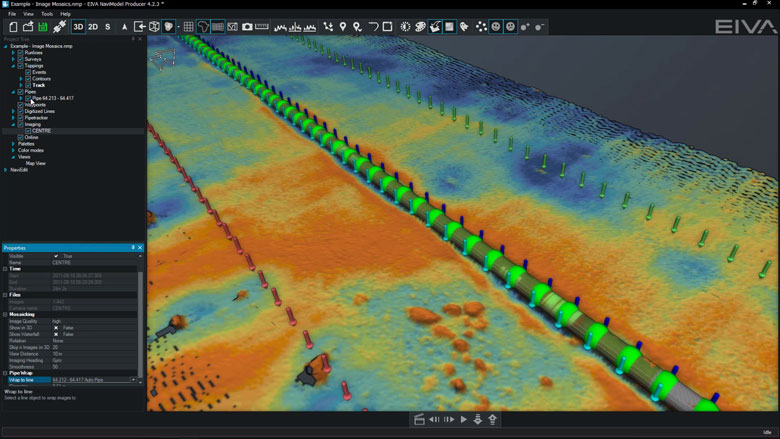
NaviModel and NaviPac share the same 3D engine, and therefore the same powerful 3D visualisation features. Data can be visualised in 2D, 3D, side view or by time.
General visualisation features
NaviModel and NaviPac share the same 3D engine, and therefore the same powerful 3D visualisation features. Data can be visualised in 2D, 3D, side view or by time.
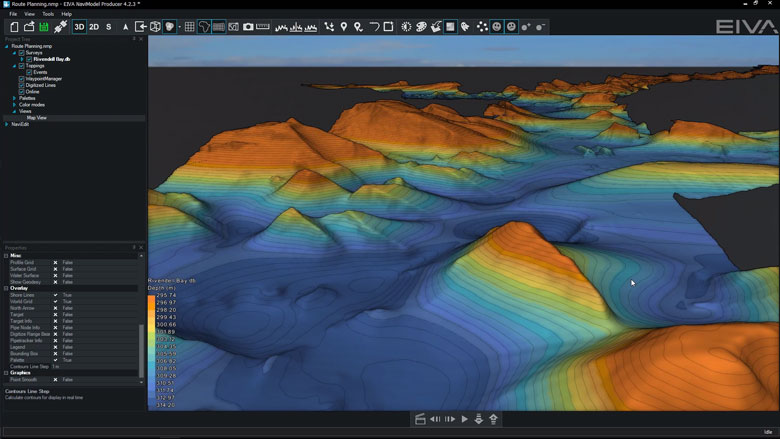
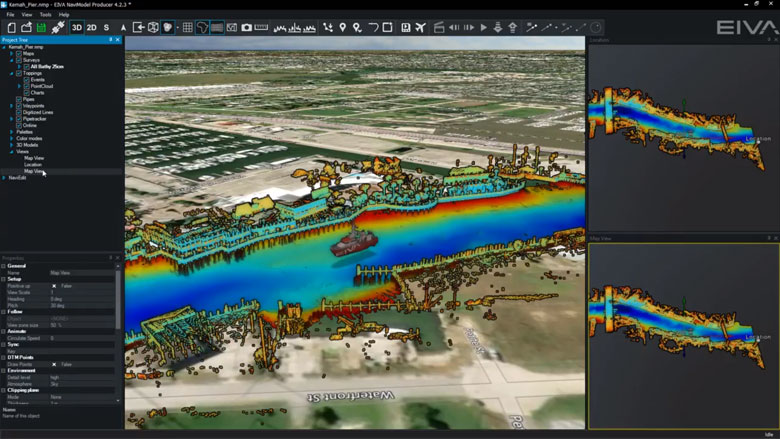
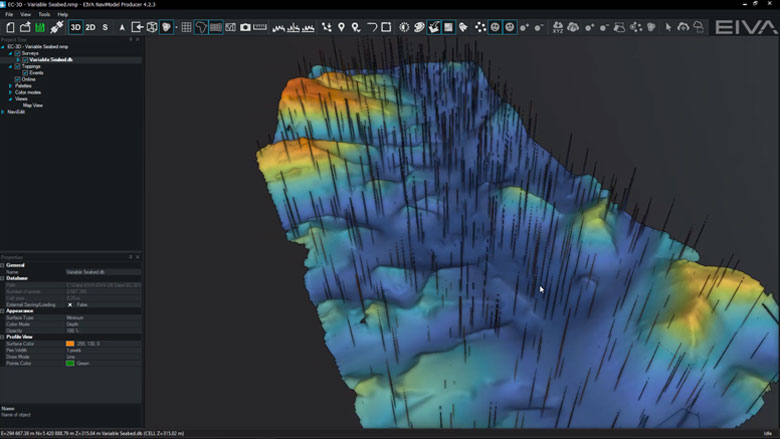
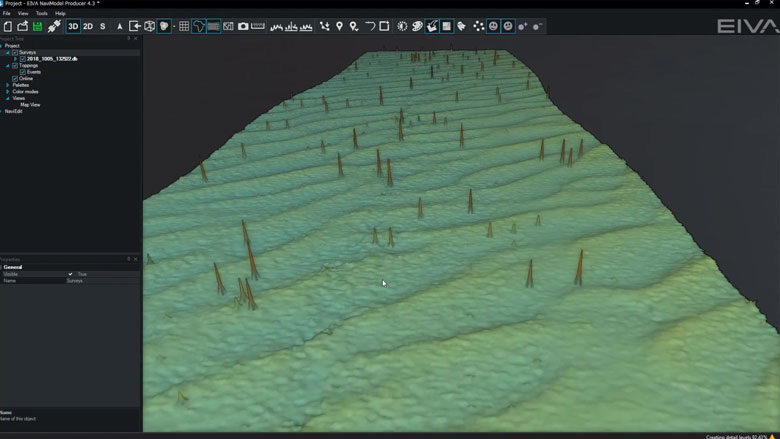
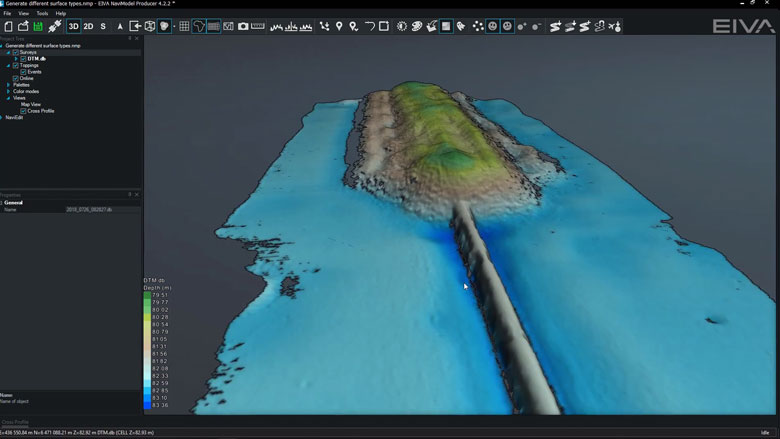
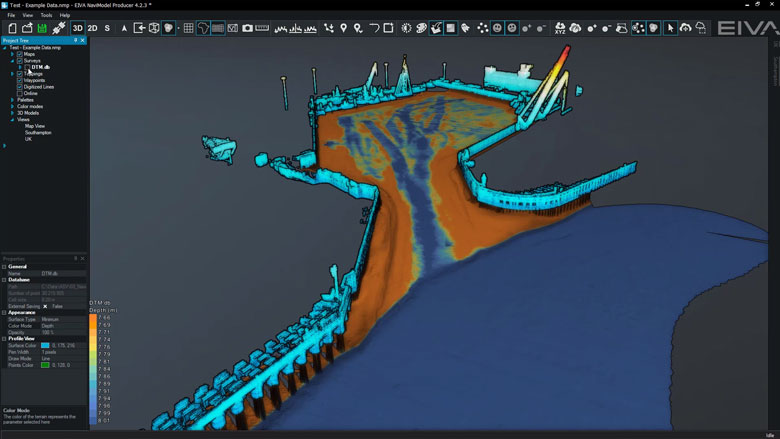
3D seabed terrain
Seabed terrain can be visualised in a 3D environment.
Multiple Map Views
Multiple Map Views are available. Each individual Map View window can be configured separately to display only the information required.
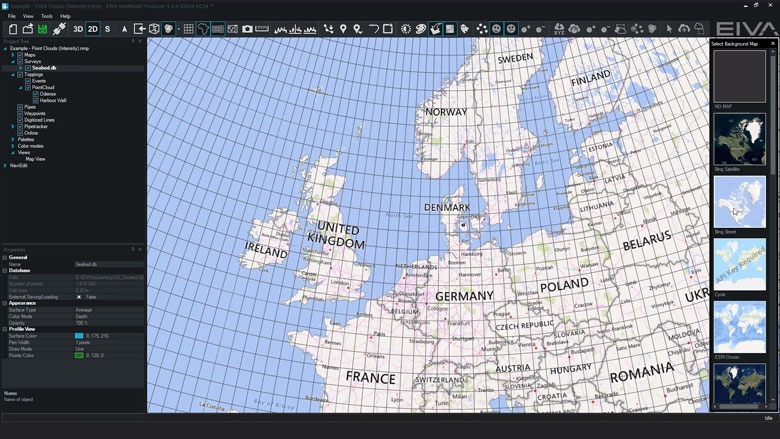
Background Maps
Background Web Map Service (WMS) maps can be displayed.
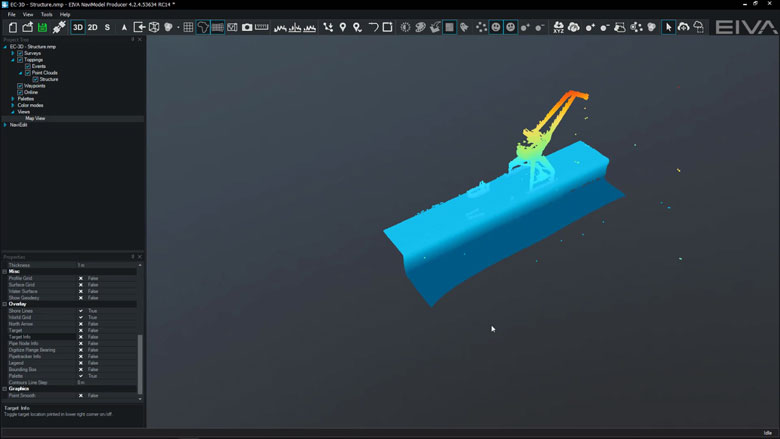
Import 3D models
3D models can be imported into NaviModel (drag and drop into the Map View window).
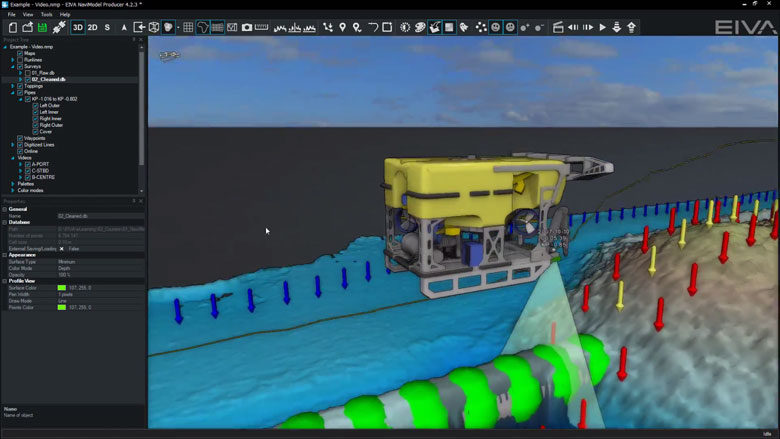
Link 3D models to live objects
3D models can be linked to any live objects (Vessel, ROV, Scanfish etc).
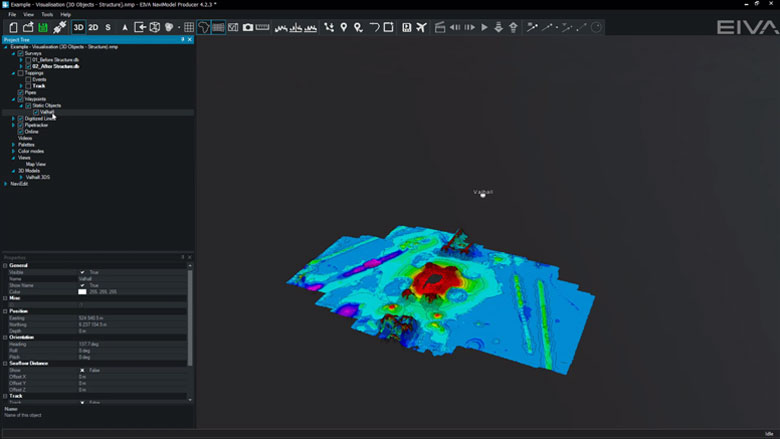
2D, 3D and side-view displays
2D, 3D or Side views allows the user to quickly change the view facilitating better data interpretation.
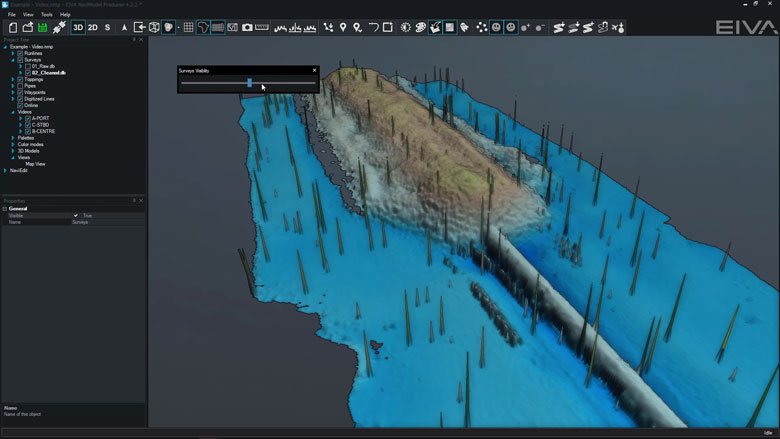
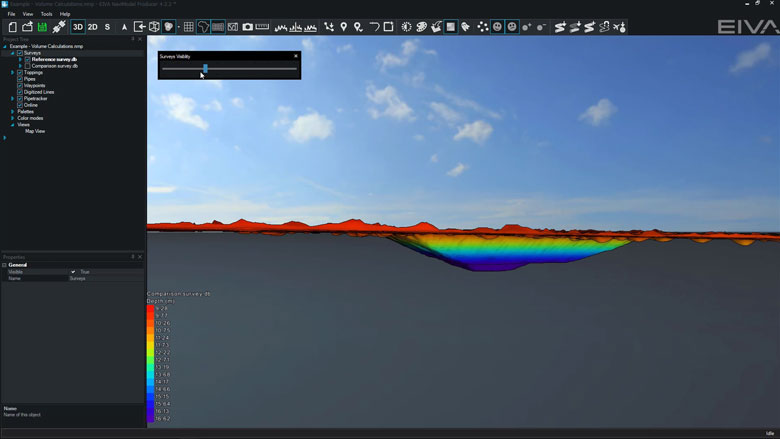
Visibility Slider
Visibility slider allows users to compare different DTM’s quickly. This enables comparison over time or between different data processing methods.
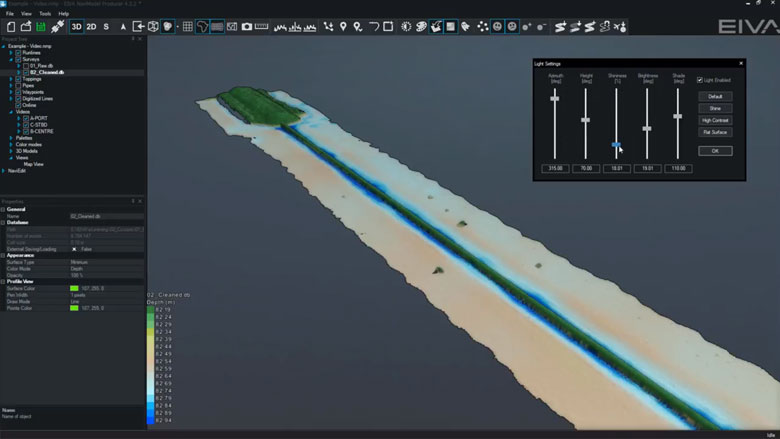
Control colours, lights, details
DTM light and palette settings can be changed at any time.
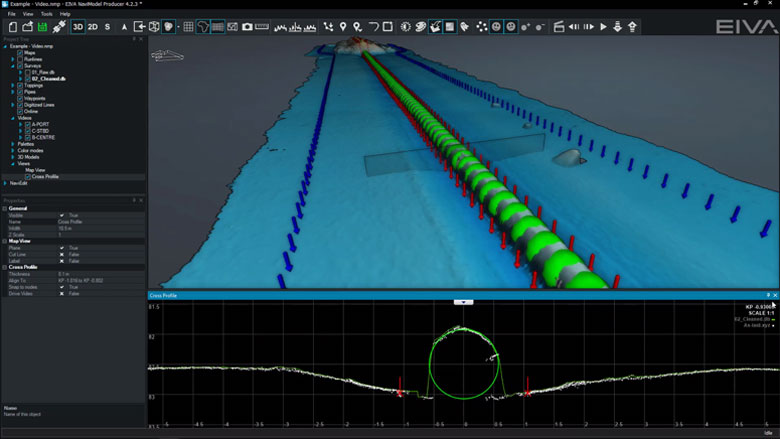
Profile views
The following profile views are available:• Cross Profile• Long Profile• Quick Profile• X & Y Axis Profile• View Profile
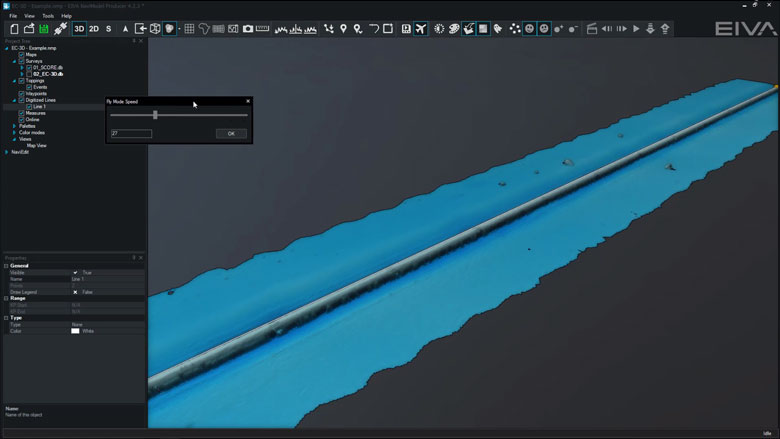
Create fly-through videos
Fly-through videos can be created for project or promotional presentations.
-
Navigation and routes
NaviPac is an integrated navigation and data acquisition software solution that includes surface and subsea navigation, route and waypoint planning, live tracking and piloting.
Navigation and routes features
Navigation and data acquisition are integrated in this software solution. Efficiently and easily navigate surface and subsea vessels using intuitive tools to plan routes and waypoints, track or pilot a vessel and more.
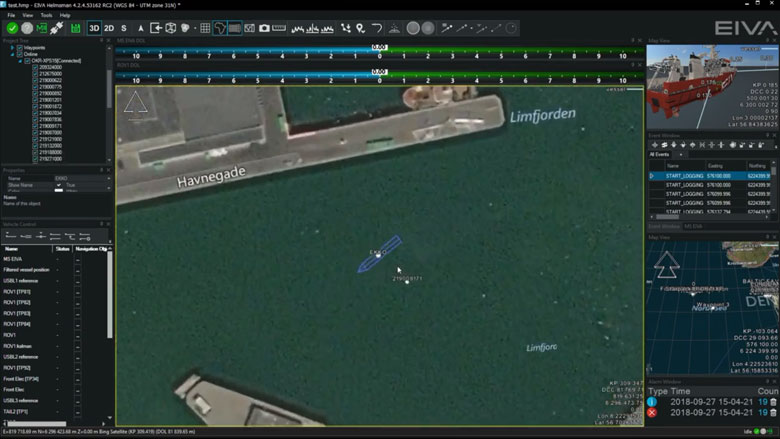
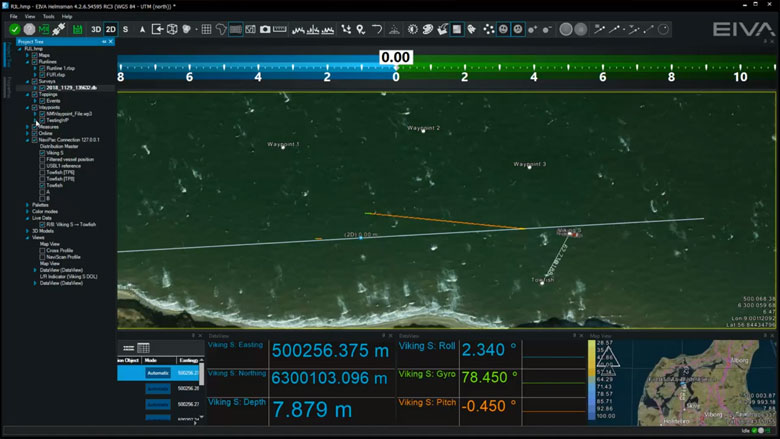
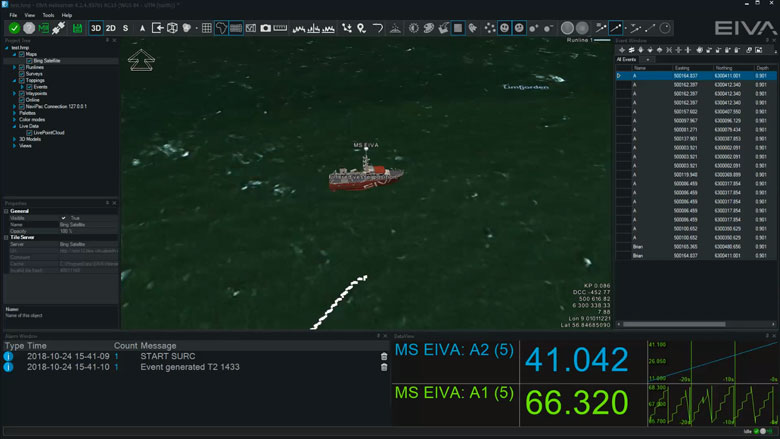
Display live position of a vehicle
NaviSuite supports display of vehicle data based on the NaviPac data feed. You can display the main vessel along with one subsea vehicle, such as an ROV or ROTV, on an unlimited number of local and remote displays. The data can be shown graphically in multiple map views.
AIS tracks
NaviSuite supports integration with AIS receivers. The data can be shown in a dedicated AIS window and overlaid in the NaviPac window. You can perform, read and utilise vessel dimension information.
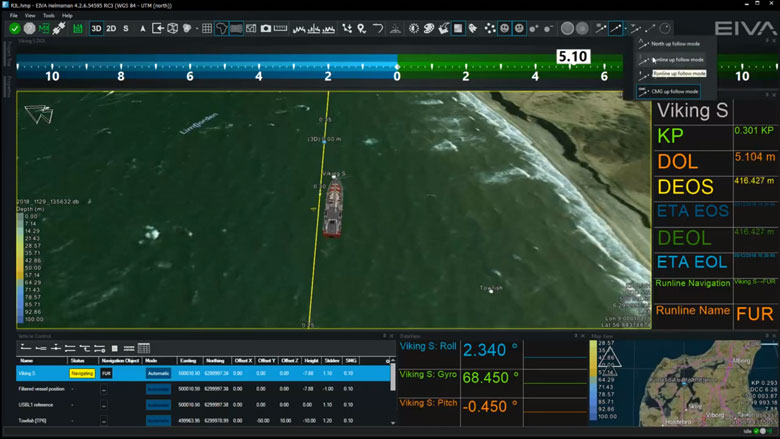
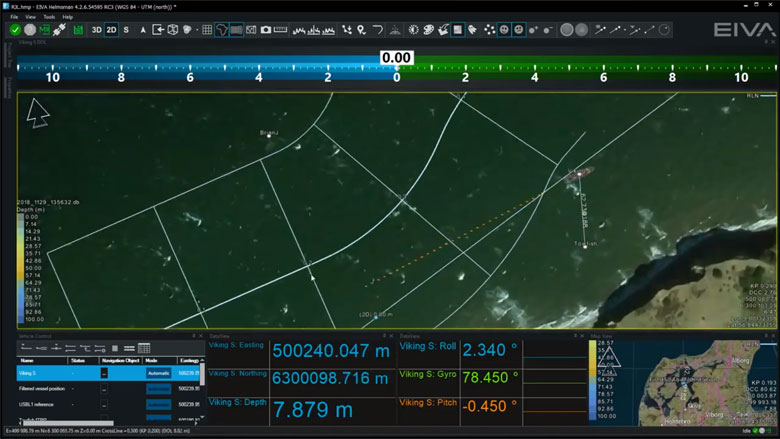
Display north-up, heading-up, route-up
Each Map View can be designed and controlled individually when it comes to content, overlays and layout. Map Views can be 2D, 3D or side-views, and orientation can be user defined, north-up, vehicle up or line up.
Manual waypoint drawing
NaviSuite supports a series of runline and waypoint formats including our own RLX/WPT format, ad generic ASCII readers. You can also draw lines and points directly in the Map View.
Various runline patterns (parallel, cross, star)
You can inherit multiple lines based on the base line defined, such as parallel or cross lines to get an optimal route plan.
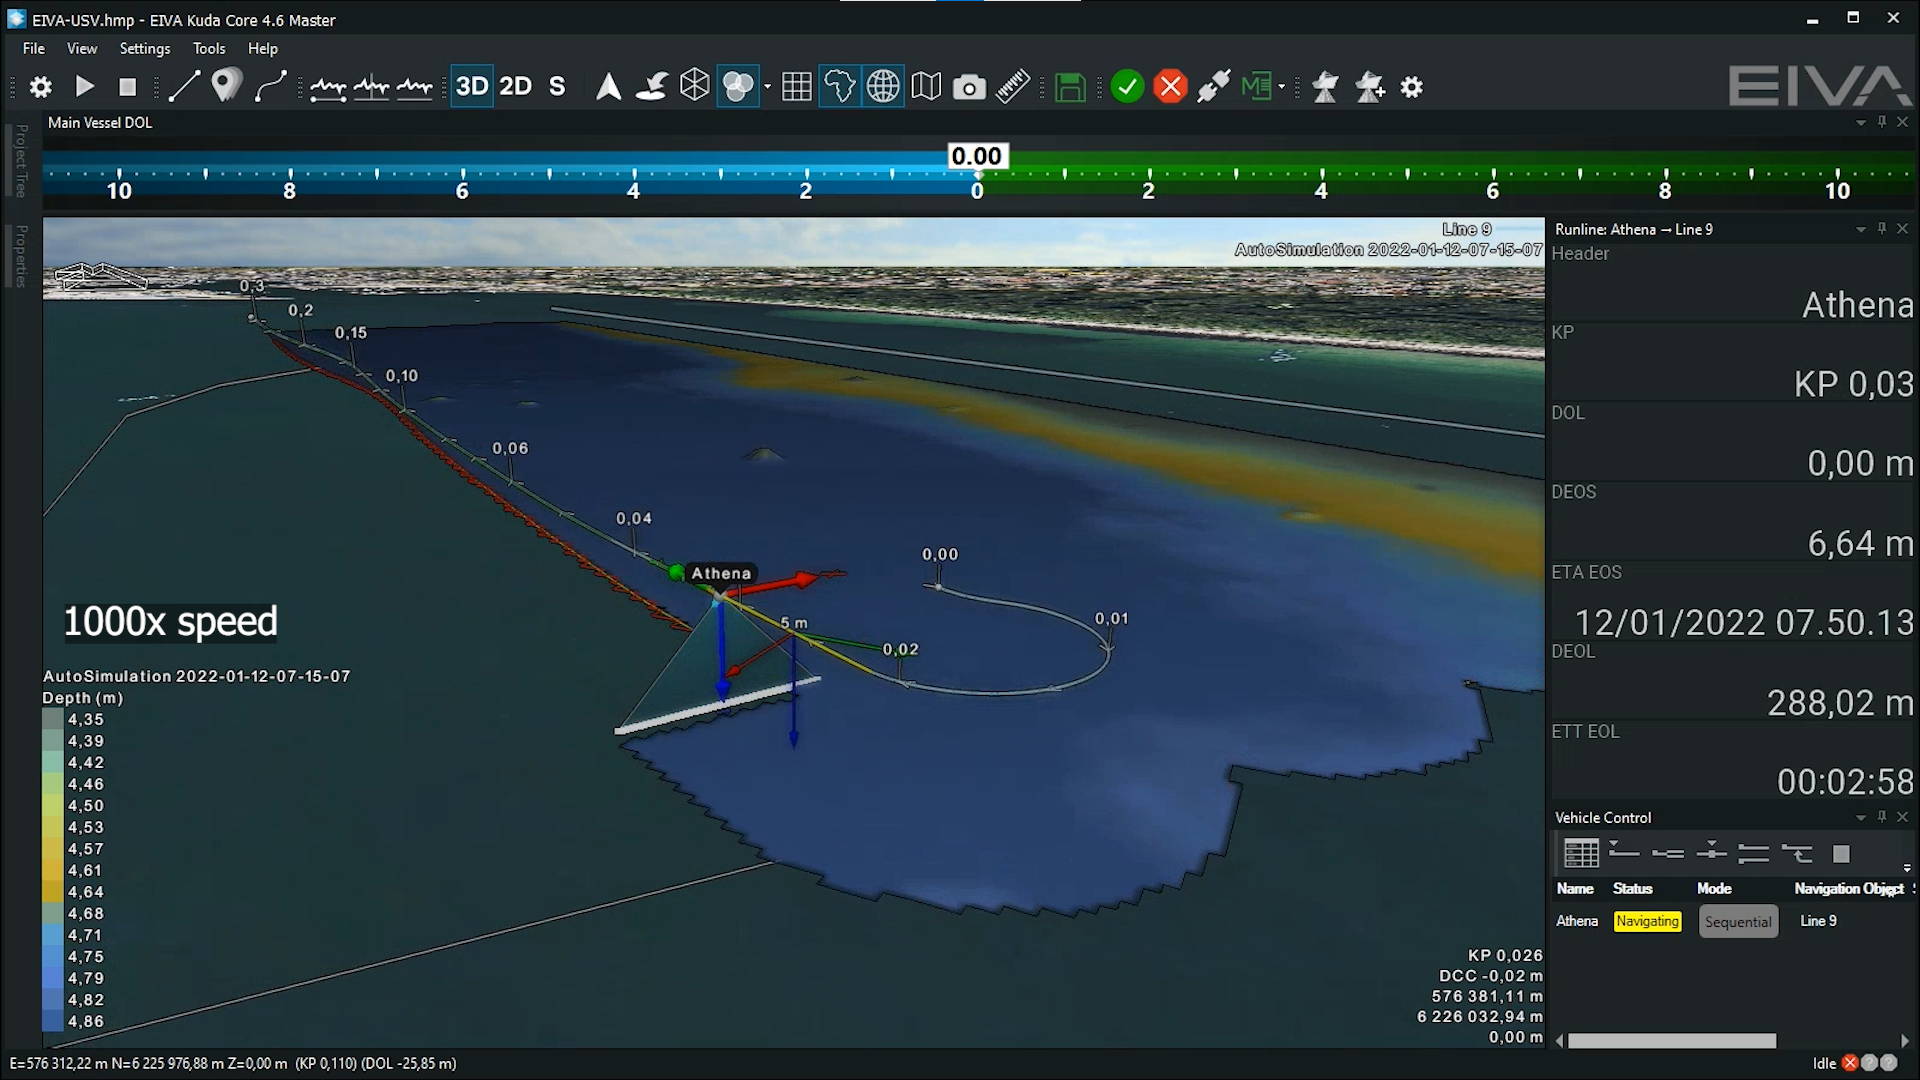
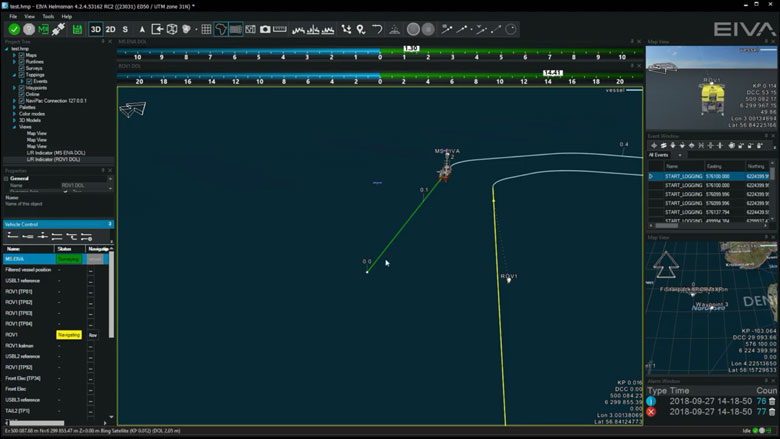
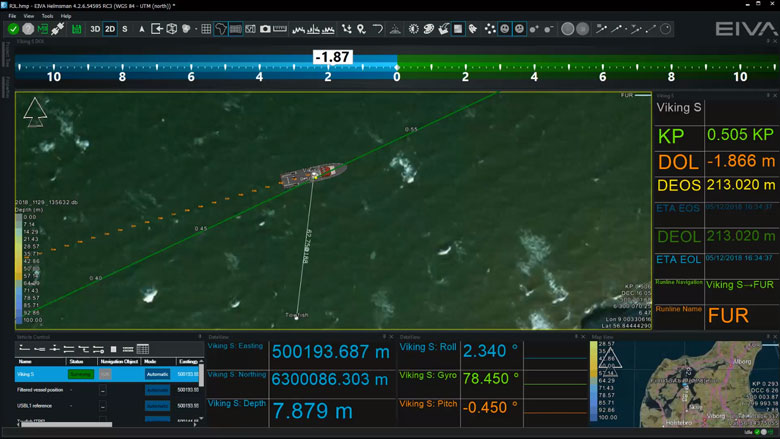
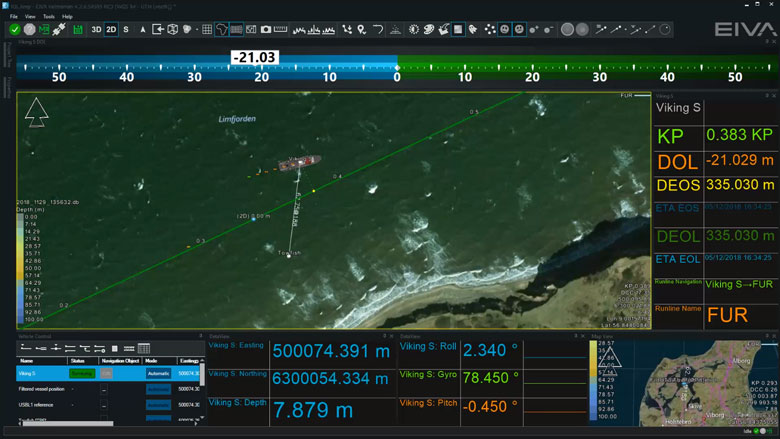
Vehicle control panel for multiple vehicle runlines and display DOL
Assignment of lines and waypoints are handled through the dedicated Vehicle Control view, as you may control multiple vehicles simultaneously. Each controlled vehicle will be available as distance offline indicator (DOL/DCC) and various runline information (along line, target ETA etc).
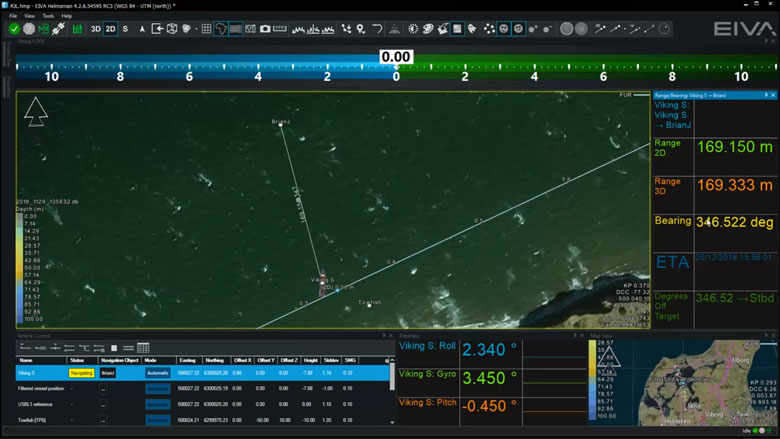
Distance to waypoint
Waypoints are handled in a similar manner to runlines, as assignment of the waypoint is done in the Vehicle Control View. Hereafter, an artificial runline is created from the vehicle to the point and NaviPac monitors the range/bearing to the destination. and can a,.o. feed that into autopilots and DP systems.
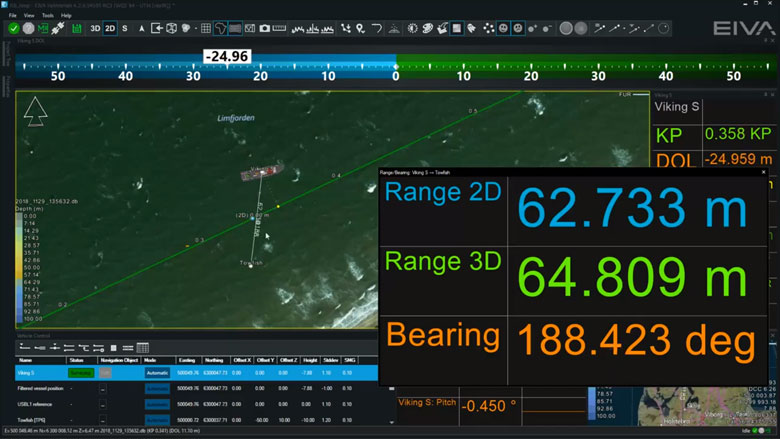
Multi-object live range/bearing
In NaviSuite, you may pair live vessels and monitor the range/bearings between them for online display as live data and range information on Map Views.
Auto-pilot (NMEA) control
When using runlines and waypoints you may connect NaviPac to autopilot systems using e.g., standard NMEA formats and pass cross-track error and destination waypoints on to the equipment.
DataUnits
NaviSuite supports use of other data units in addition to metric. The unit is selected in the project settings and all definition fields are then assumed to be in the selected data unit.
NaviSuite will follow the selected data unit, but you may, by using a simple keystroke, toggle between metric and data unit if required.
Data recording will still be metric to guarantee data integrity, but data outputs can be selected freely.
-
Sensor interfacing and recording
Many different sensors can be interfaced and integrated in both NaviScan and NaviPac.
Sensor interfacing and recording features
Many different sensors can be interfaced and integrated in both NaviScan and NaviPac.
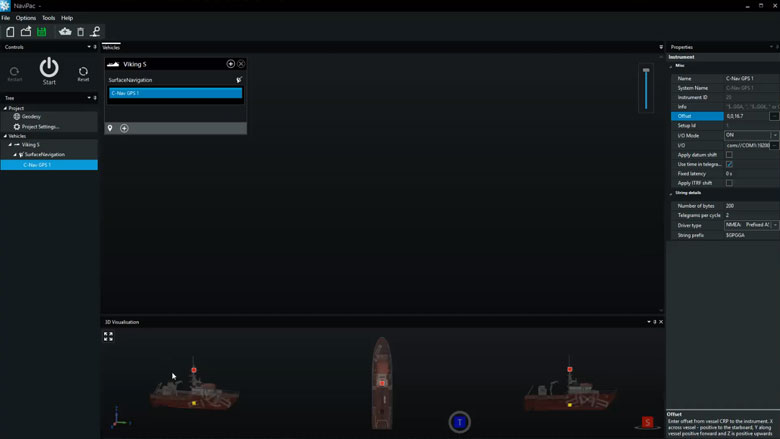
Surface positioning and motion (GPS, Gyro, IMU)
Setting up an entire vessel based project in NaviPac is easy performed using intuitive graphical definition tools. The video covers basic project definition, geodetics and vessel navigation setup.
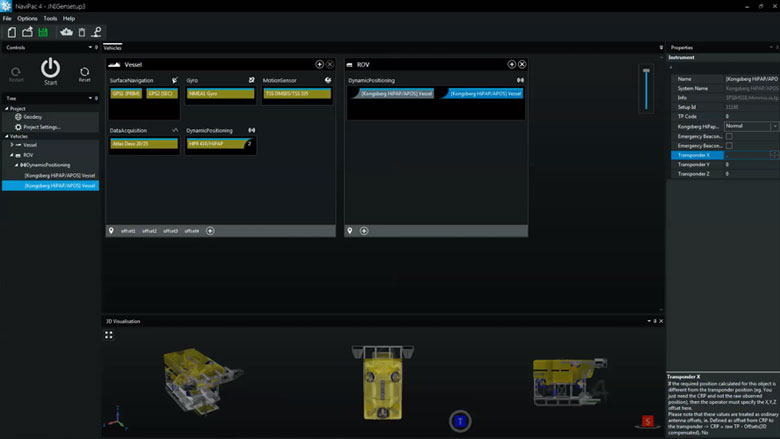
Subsurface positioning (USBL, DVL, INS, Gyro, IMU)
Setting up remote and subsea vehicles is done in a similar manner to the main vessel – easy and intuitive. Adding instruments, positioning sources (transponders, INS, LBL etx) and defining weighting and Kalman filter settings is possible.
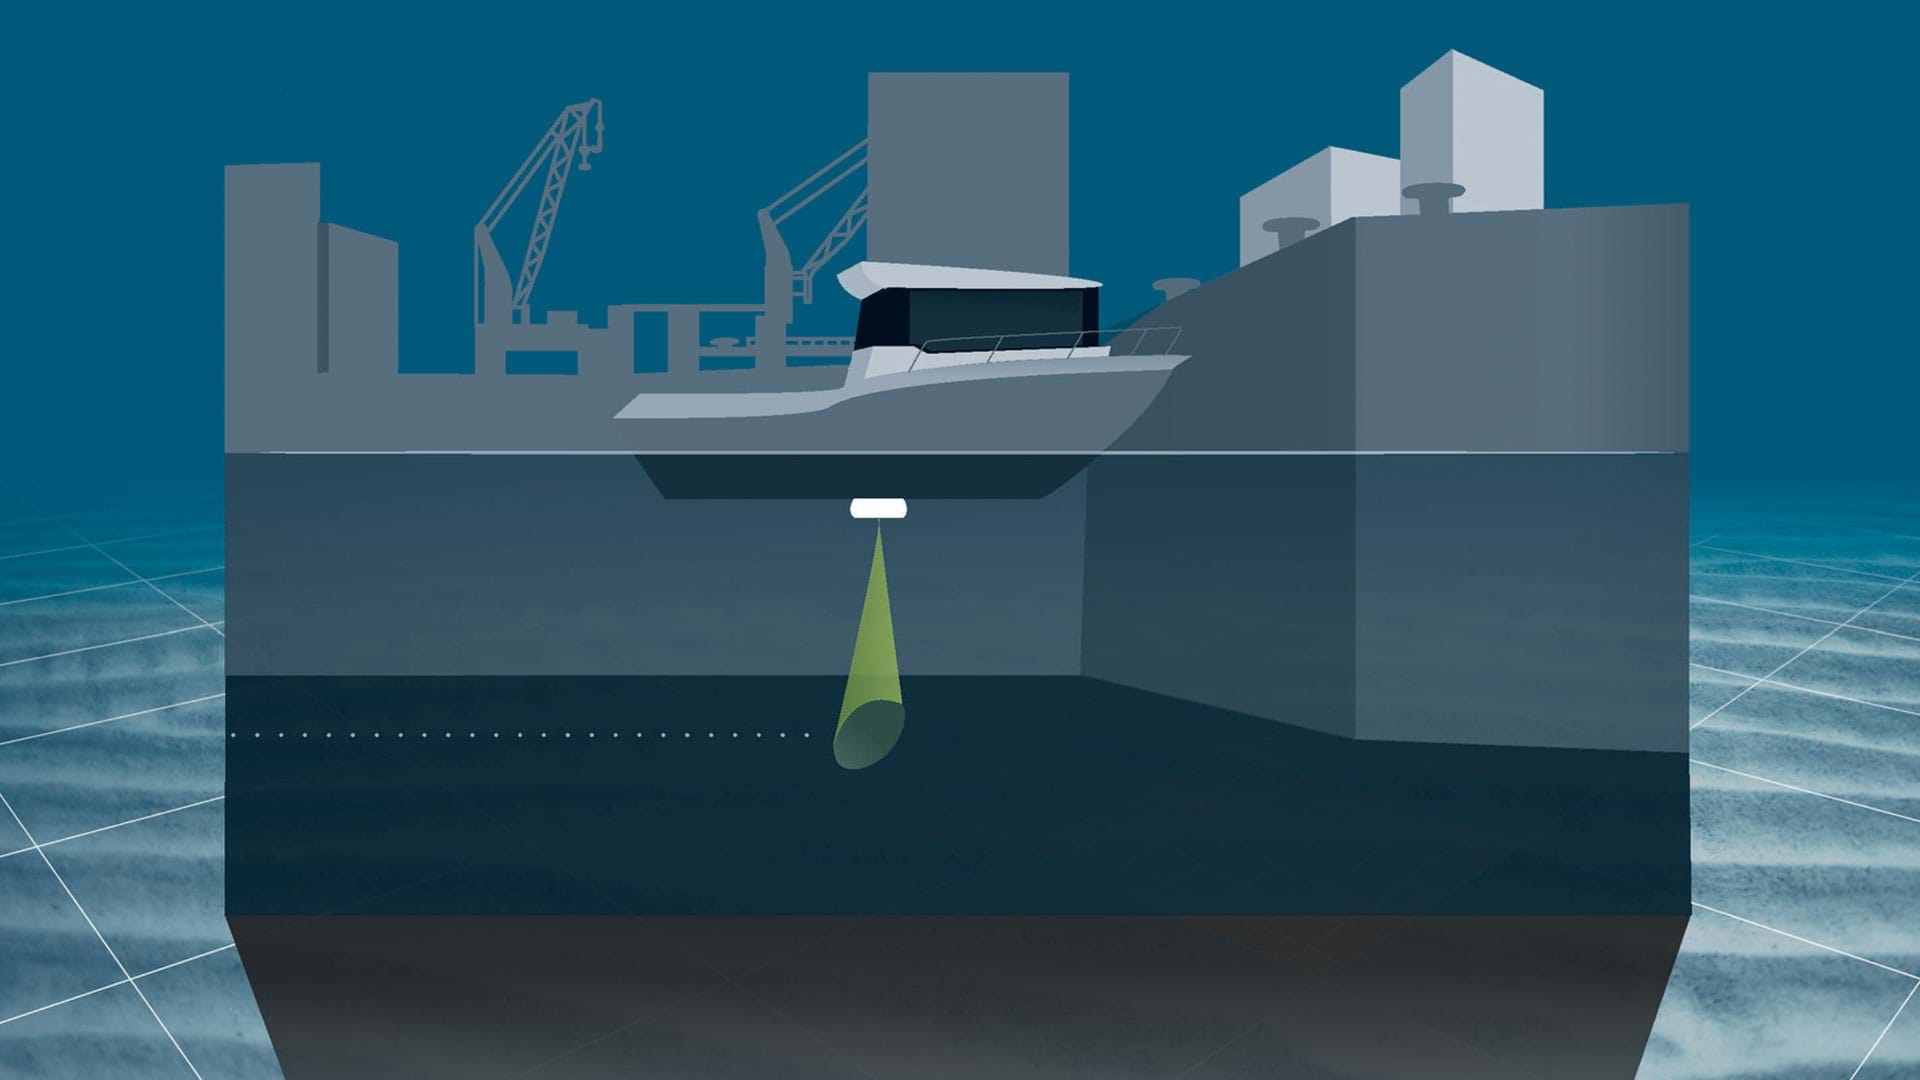
SBE - single beam echo sounder
Single beam echo sounders and other single source data suppliers can easily be interfaced in NaviPac, either via standard drivers or enhanced user-configurable drivers. Data will be available for display in both Helmsman’s Display and DataMon. Single source data can be shown as points clouds in the HMD – and you can automatically derive DTMs out of it.
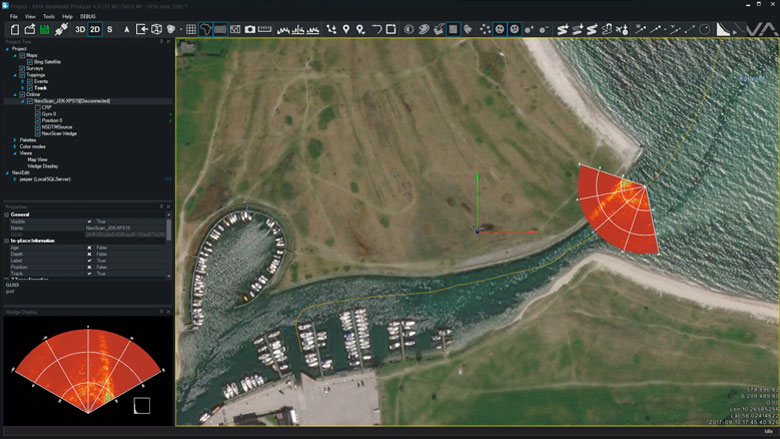
FLS - forward looking sonar (wedge and mosaic)
NaviScan supports a series of forward looking sonars such as eg. Tritech, Didson and Norbit. The data will be interfaced and recorded in NaviScan and made available for display in HMD as both stand-alone wedge display and 3D wedge display in the Map views.
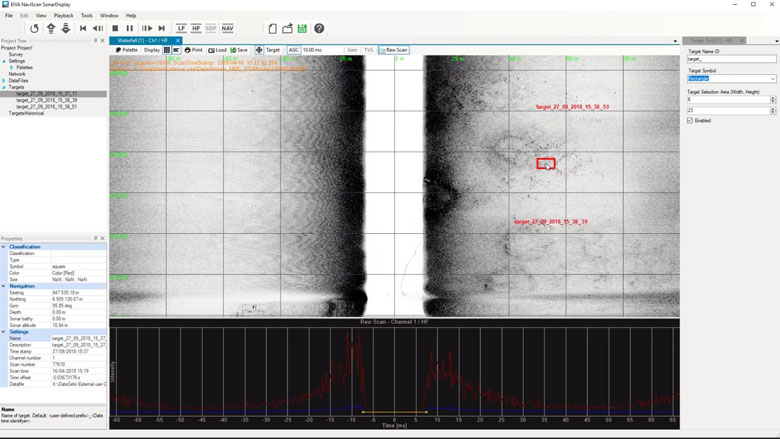
SSS sidescan sonar
Sidescan data is interfaced in NaviScan and recorded in the SBD data format. The data can be shown both in real-time and in replay in special waterfall data display. This data display will also enable target markings (eventing) and image management.
-
Sensor processing
NaviEdit can be used to recalculate data very quickly and where our sensor processing takes place. Here we change offsets, C-O’s, mounting angles, apply tide, apply SVP, de-spike sensors, improve object positioning, Kalman filtering, remove swell etc.
Sensor processing features
NaviEdit can recalculate data very quickly and where sensor processing takes place. Here we change offsets, C-O’s, mounting angles, apply tide, apply SVP, de-spike sensors, improve object positioning, Kalman filtering, remove swell etc.
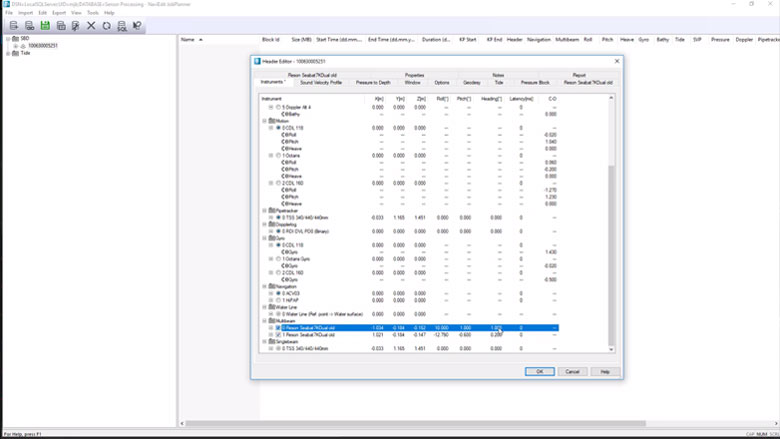
Surface positioning and motion (GPS, Gyro, IMU)
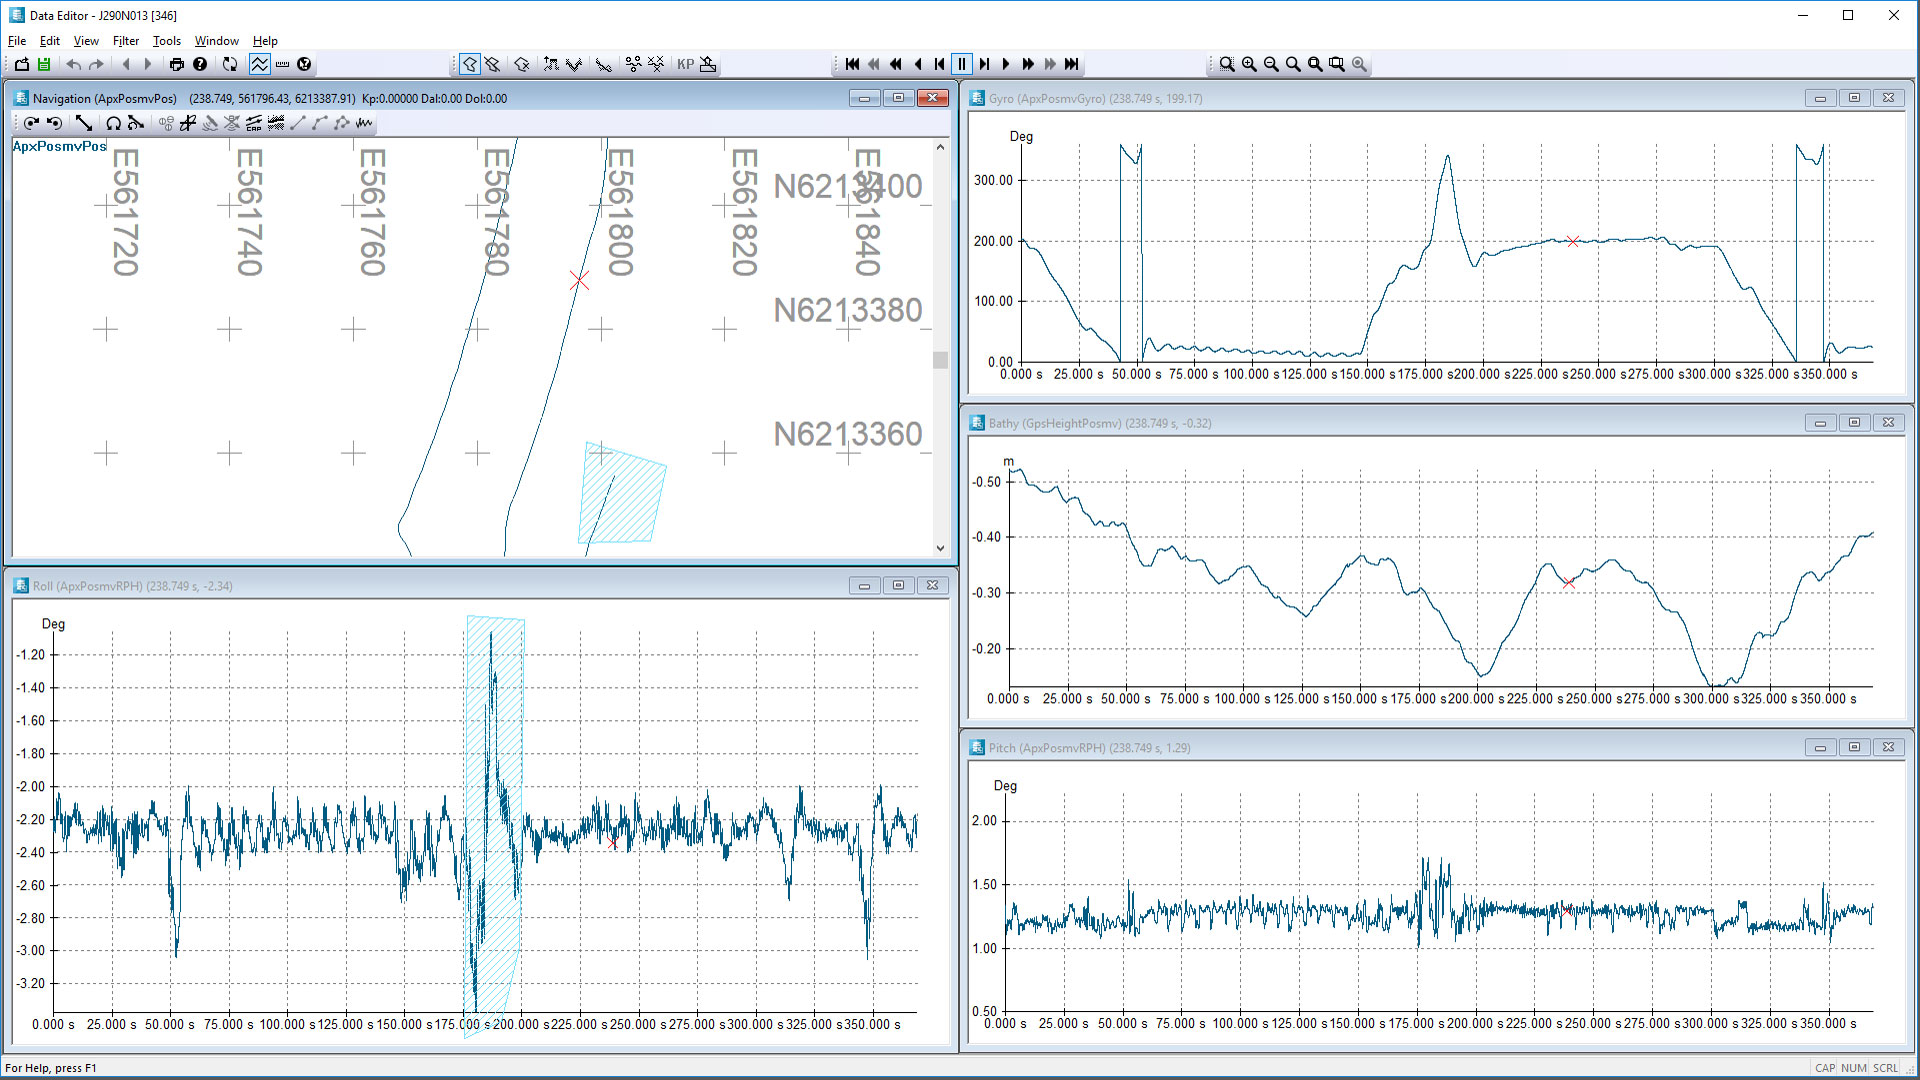
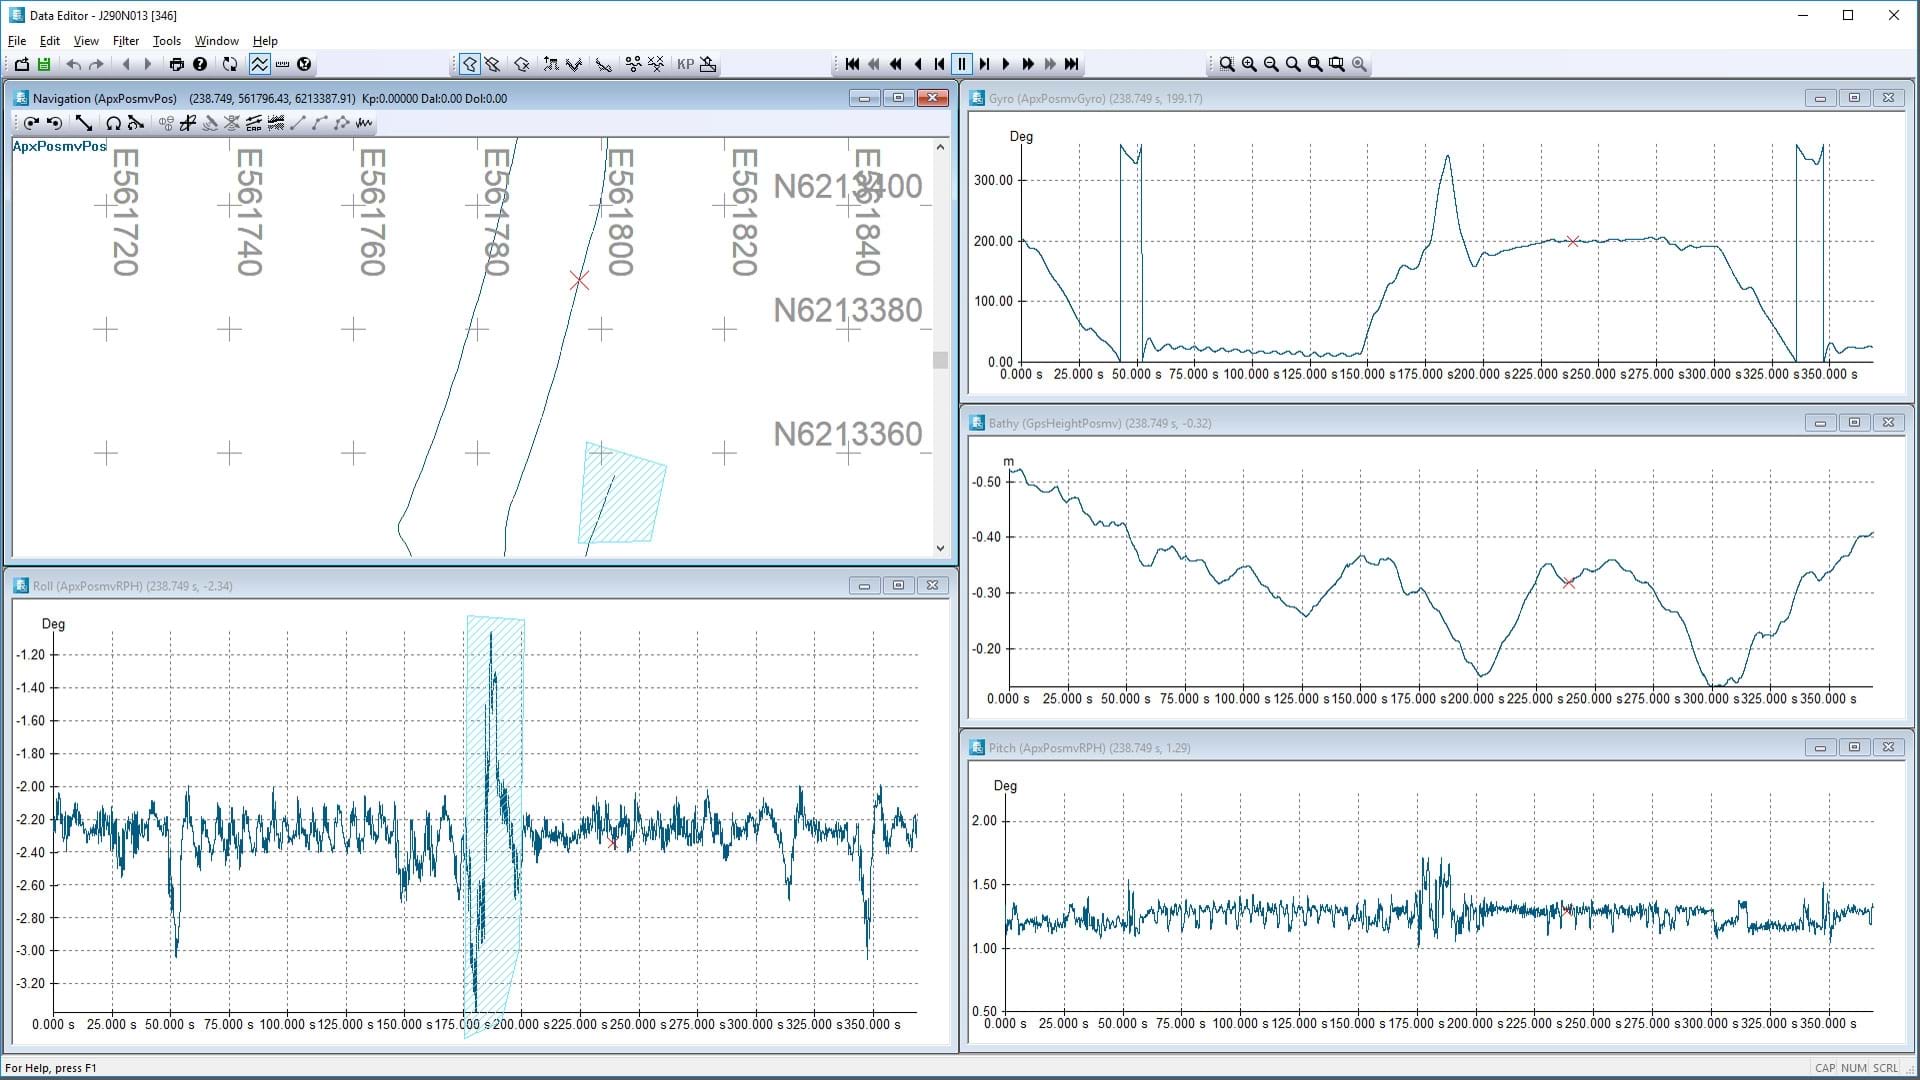
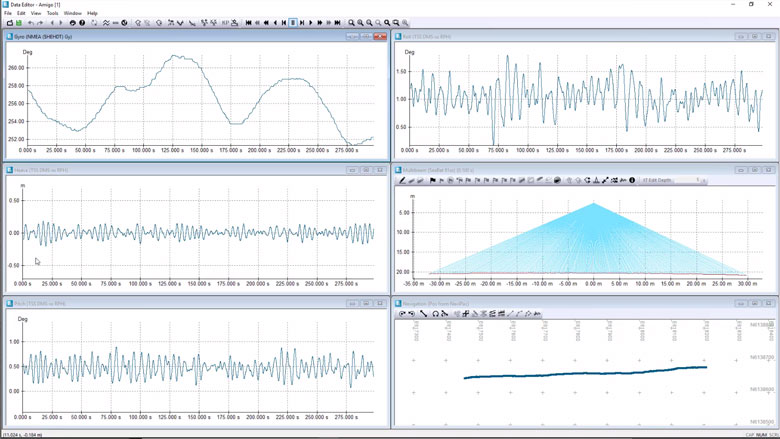
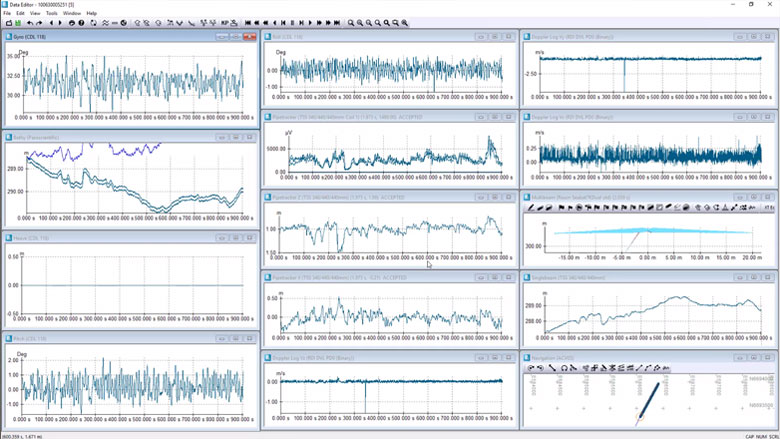
NaviEdit Header Editor allows the user to check the vessel setup.
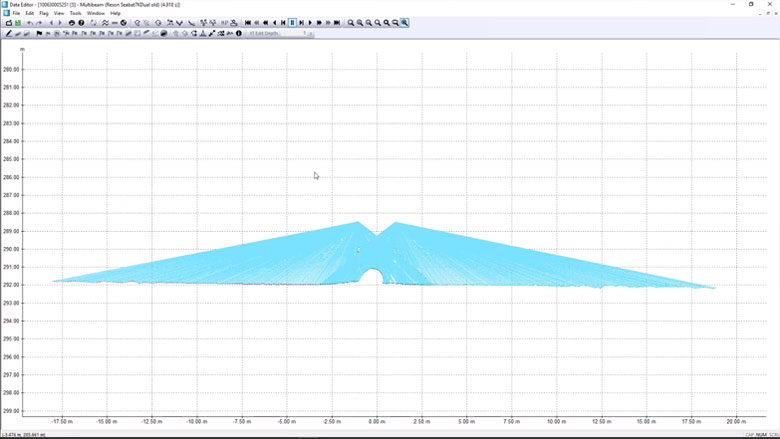
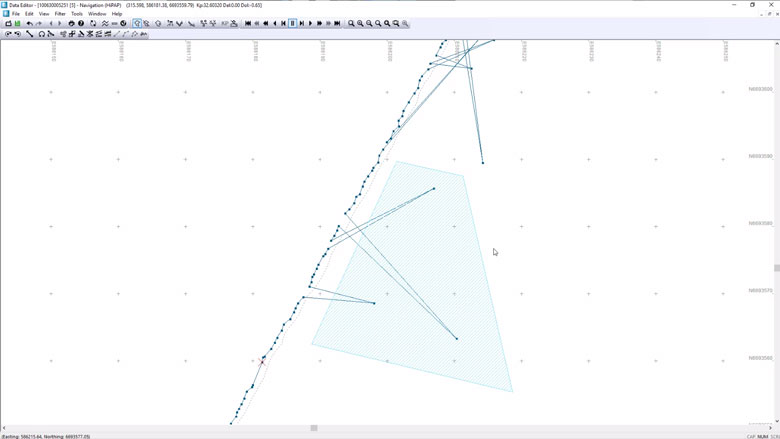
NaviEdit Data Editor allows the user to view and QC sensor data via a series of graphical displays.
Subsurface positioning (USBL, DVL, INS, Gyro, IMU)
You can check an ROV setup. View and QC sensor data via a series of graphical displays.
Tide corrections
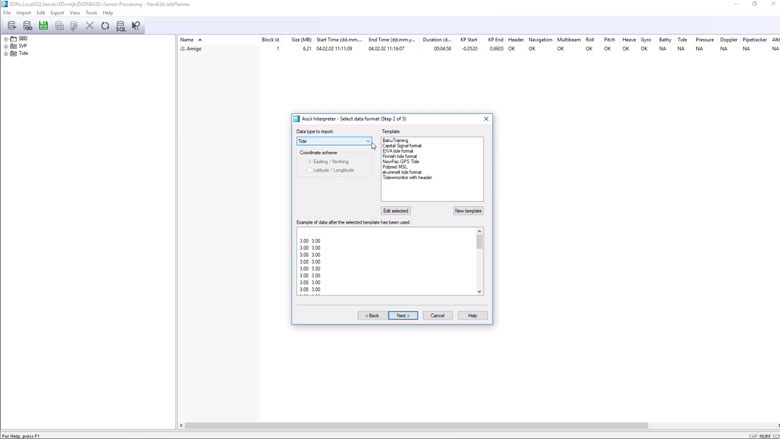
Predicted or observed tides can be imported into NaviSuite using user-defined import templates.
SVP corrections
CTD or SVP can be imported into NaviSuite using user-defined import templates.
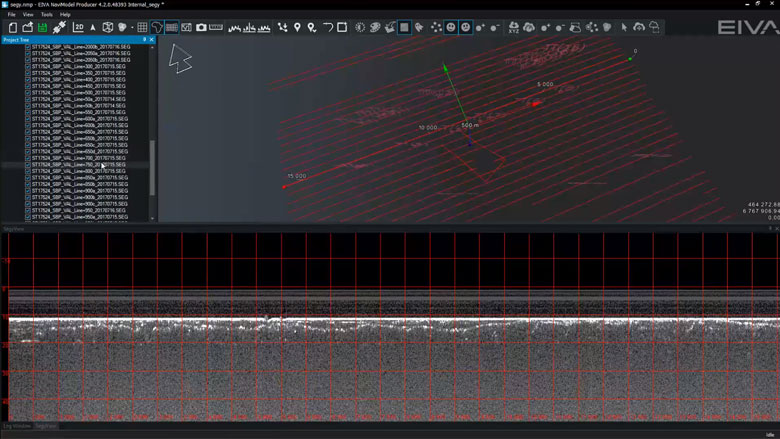
Sub-bottom profiler (SBP)
You are able to work with several SEG-Y files in NaviSuite at the same time. When loading the sub-bottom profiling data, the software extracts a rough track that is then taken through a two-step process of extracting a point every 100 metres, and then refined to 3 metres.
Change offsets, C-O's and mounting angles
Sometimes incorrect measured offsets, C-O’s or mounting angles are entered into the online acquisition system. NaviSuite enables you to correct these errors.
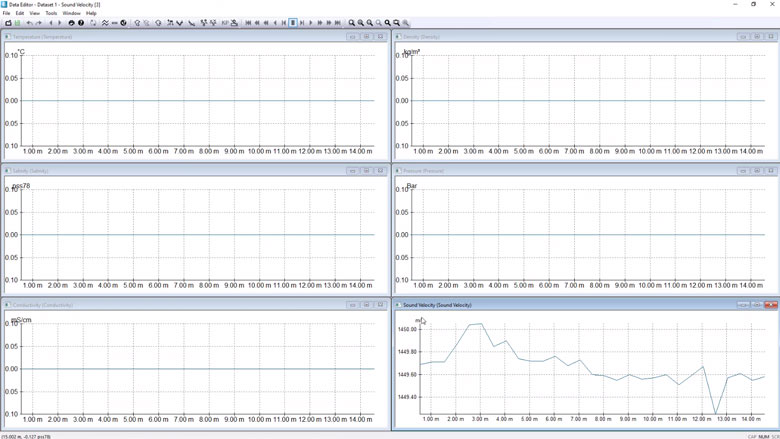
Raybending corrections
Sometimes Sound Velocity values are incorrect and we need a tool to perform a local correction. In NaviSuite, we can visualise the Sound Velocity corrections before we apply them.
Sensor editing (import and manual editing)
If required, you can run the following actions:• De-spike• Interpolate• Delete• Translate• Scale• Rotate• Smooth
-
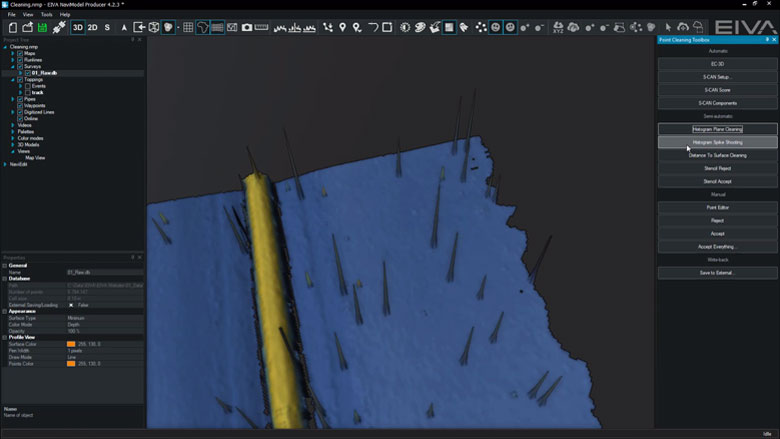
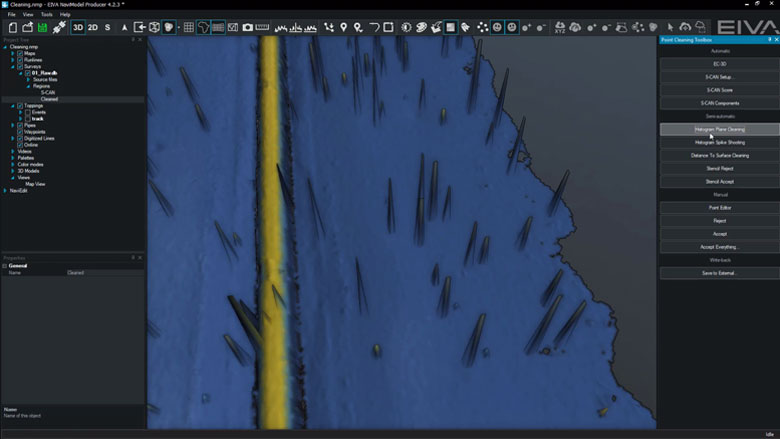
Sonar cleaning
Point data derived from sonar or laser systems can be cleaned, QC’d and edited using a plethora of manual or automatic tools. Cleaning operations can be applied multiple times to a complete data set or user-defined areas. For each cleaning operation, quality flags are assigned to every data point, so you never lose access to the original raw data.
Sonar and subsea laser data cleaning
Clean point data with a plethora of manual or automatic tools. Cleaning operations can be applied multiple times to a complete data set or user-defined areas.
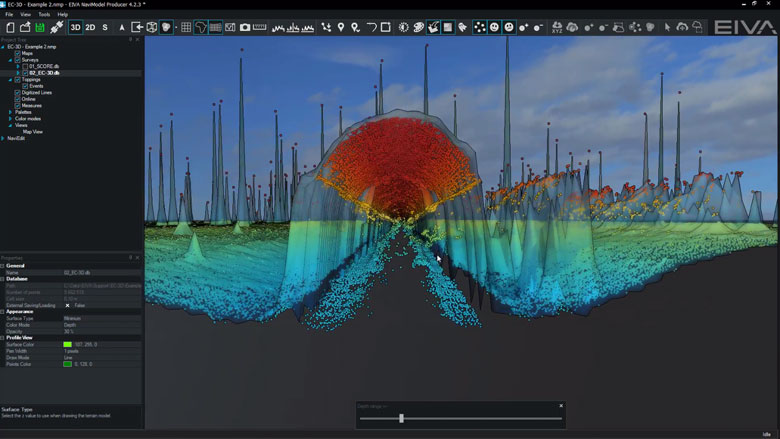
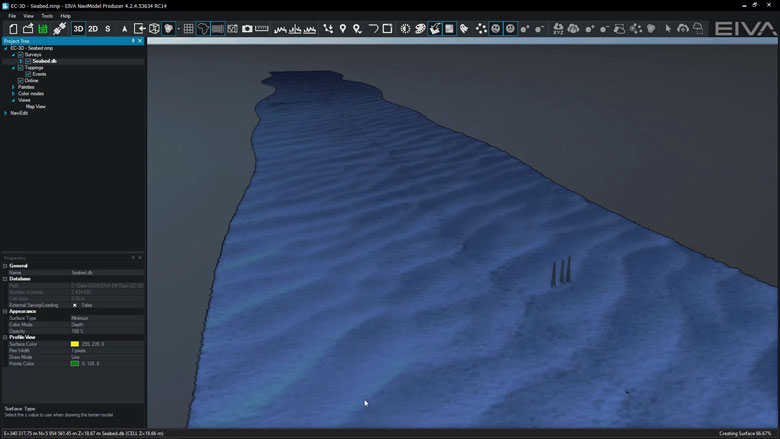
EC-3D DTM
EC-3D supports several cleaning methods and is efficient at cleaning both 3D and 2D data.It can be used to clean seabed DTMs.
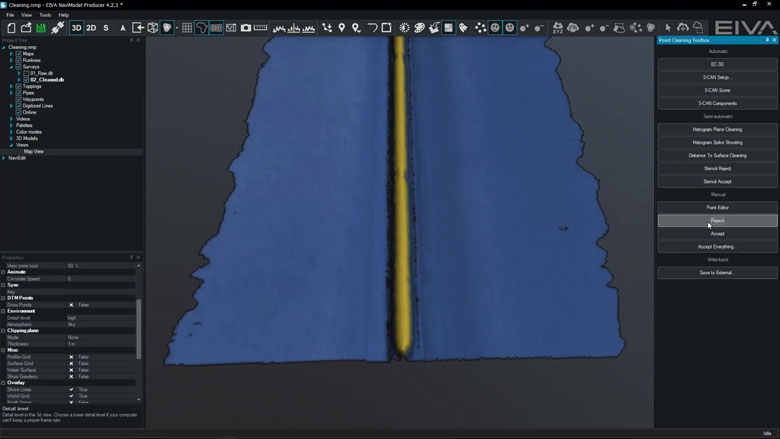
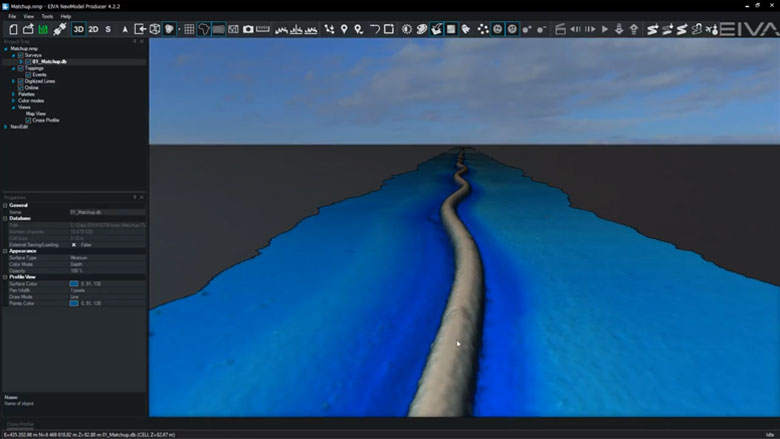
EC-3D Pipeline
EC-3D can be used to clean pipeline DTMs.
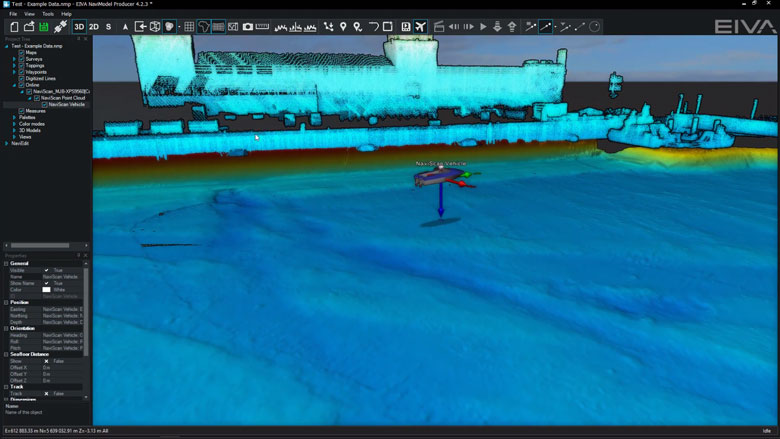
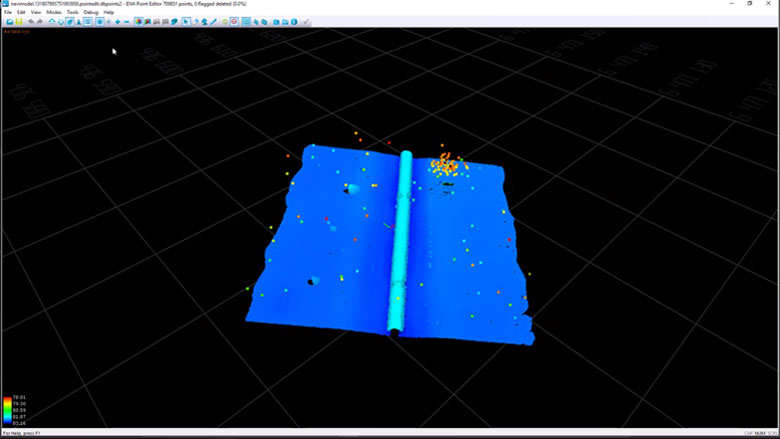
EC-3D point cloud cleaning
EC-3D can be used to clean point clouds.
EC-3D Automated
EC-3D can be used to automatically clean point clouds or DTMs.
Histogram Spike Shooting
Histogram Spike Shooting can be used to reject or accept DTM points.
Points are selected if they are inside a circle.
Histogram automatically sets the rejection thresholds (can be manually over-ruled).
Histogram Plane Cleaning
Histogram Plane Cleaning tool can be used to reject or accept DTM points.
Points are selected if they are inside a corridor, polygon or an existing boundary.
Histogram automatically sets the rejection thresholds (can be manually over-ruled).
Reject & Accept Points
These tools can be used to reject or accept DTM points.
Points are selected if they are inside a corridor, polygon or an existing boundary.
Point Editor
Point Editor can be used to manually reject or accept DTM points using an eraser (square select) or a region (polygon select). This tool will soon be replaced with a newer version within NaviModel.
-
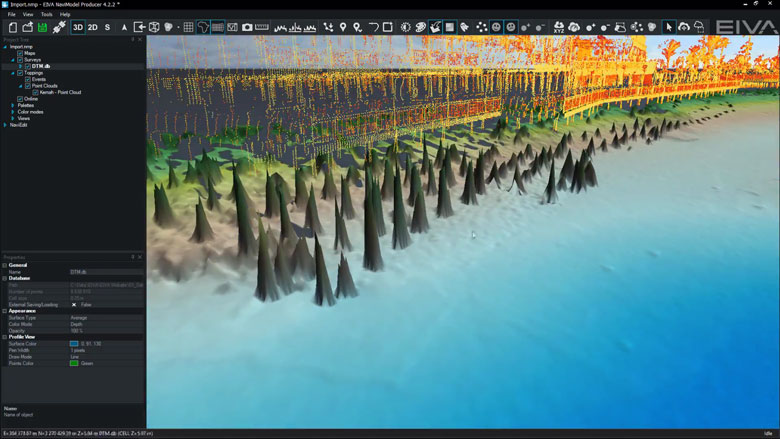
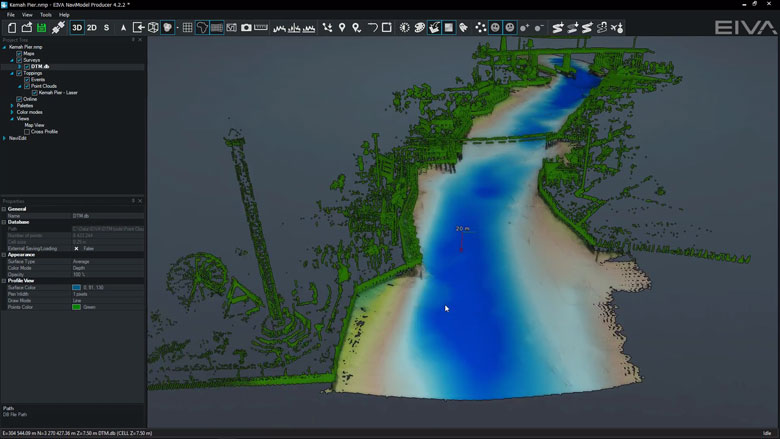
Point cloud tools
Create point clouds from sonar and laser systems or from historical XYZ files. Within NaviModel, there are many ways to visualise, edit and optimise point data.
Point cloud features
We can create point clouds from sonar and laser systems or from historical XYZ files. Within NaviModel, there are many ways to visualise, edit and optimise point data.
Import XYZ files
You can easily model historical data in NaviSuite Kuda and use it for example to plan your survey or compare your results with earlier observations. If you have data in a known format, such as generic ASCII XYZ files, these can be imported as DTMs, point clouds, or TIN models.
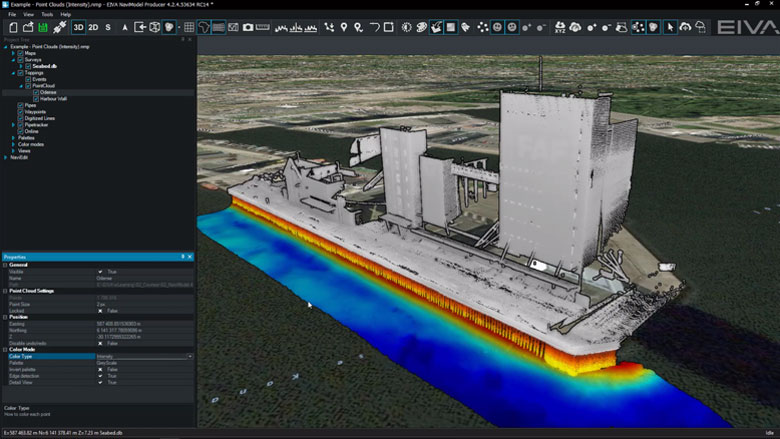
Point clouds with RGB and Intensity
By default, point clouds can be visualised as a solid colour or as a depth palette. However, if source files contain RGB or Intensity values, we can choose to colour the point cloud with this information instead.
EC-3D point cloud cleaning
EC-3D can be used to clean point clouds.
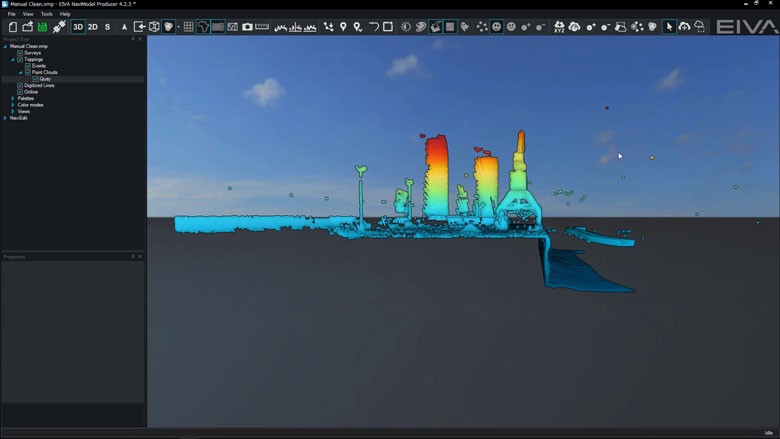
Manual cleaning
A selection window or a polygon can be used to manually clean point clouds.
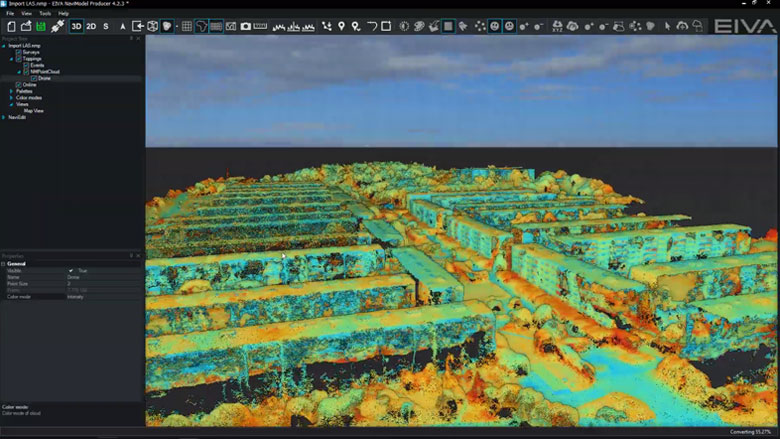
Import LAS files and display as RGB or Intensity
LAS and LAZ files can be imported as DTMs or as point clouds, meaning you can use NaviSuite’s powerful modelling capabilities for validating data in this format. You can also export your model to this format.
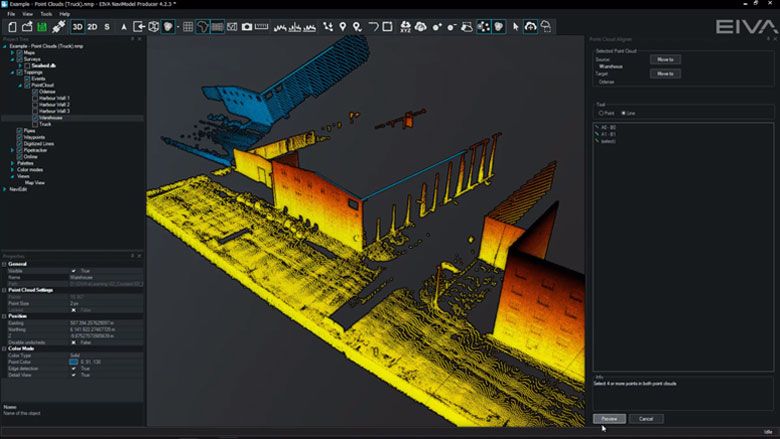
Point Cloud Registration (QuickStitch)
If point clouds are misaligned, we can use Point Cloud Registration to align them. We accomplish this by first digitising common features, and then performing a least-squared adjustment that moves one point cloud to another.
-
DTM tools
In NaviSuite Digital Terrain Models (DTMs) can be generated, manipulated, and edited with the help of various tools.
DTM features
In NaviSuite, Digital Terrain Models (DTMs) can be generated, manipulated, and edited with the help of various tools.
Create DTM surface from points (sonar & laser)
DTM surfaces and Point Clouds can be generated at any time from either sonar or laser data.
Create different DTM surfaces (mean, max, min, etc) and colour modes
Different surface types are generated upon data import and can be accessed at any time.
Light and Palette settings
DTM light and palette settings can be changed at any time.
Visibility Slider
Visibility slider allows users to compare different DTMs quickly.
This enables comparison over time or between different data processing methods.
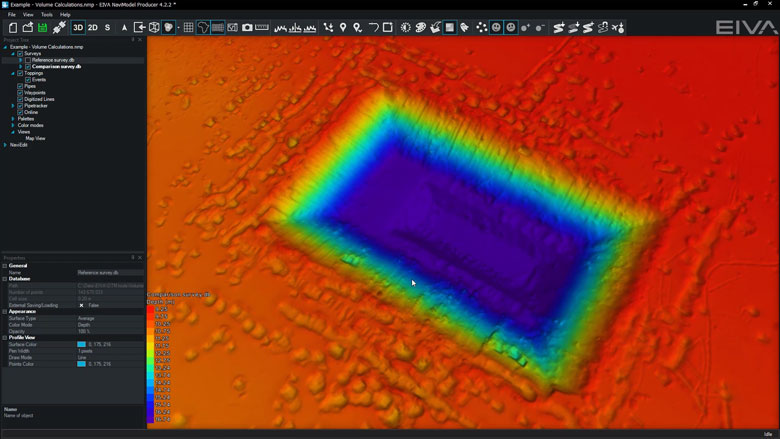
Difference models
DTMs can be created from the differences between two other existing models.
Volume calculation
A volume calculation is the difference between a reference surface and a comparison surface.Surfaces can be from a DTM or a TIN model.Volume calculations can take place between the following models:• DTM vs DTM• TIN vs TIN• DTM vs TIN
Density surface
Density colour mode can be enabled to QC how many points are in each DTM cell.
Custom surface
It is possible to create custom surfaces based upon hard-coded variables or user-configurable equations.
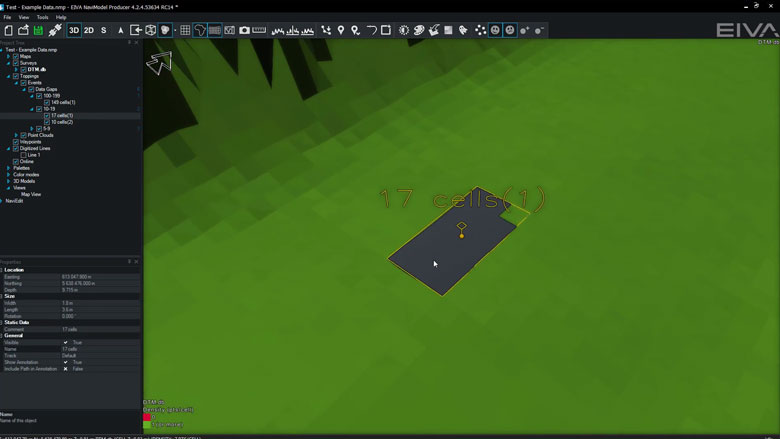
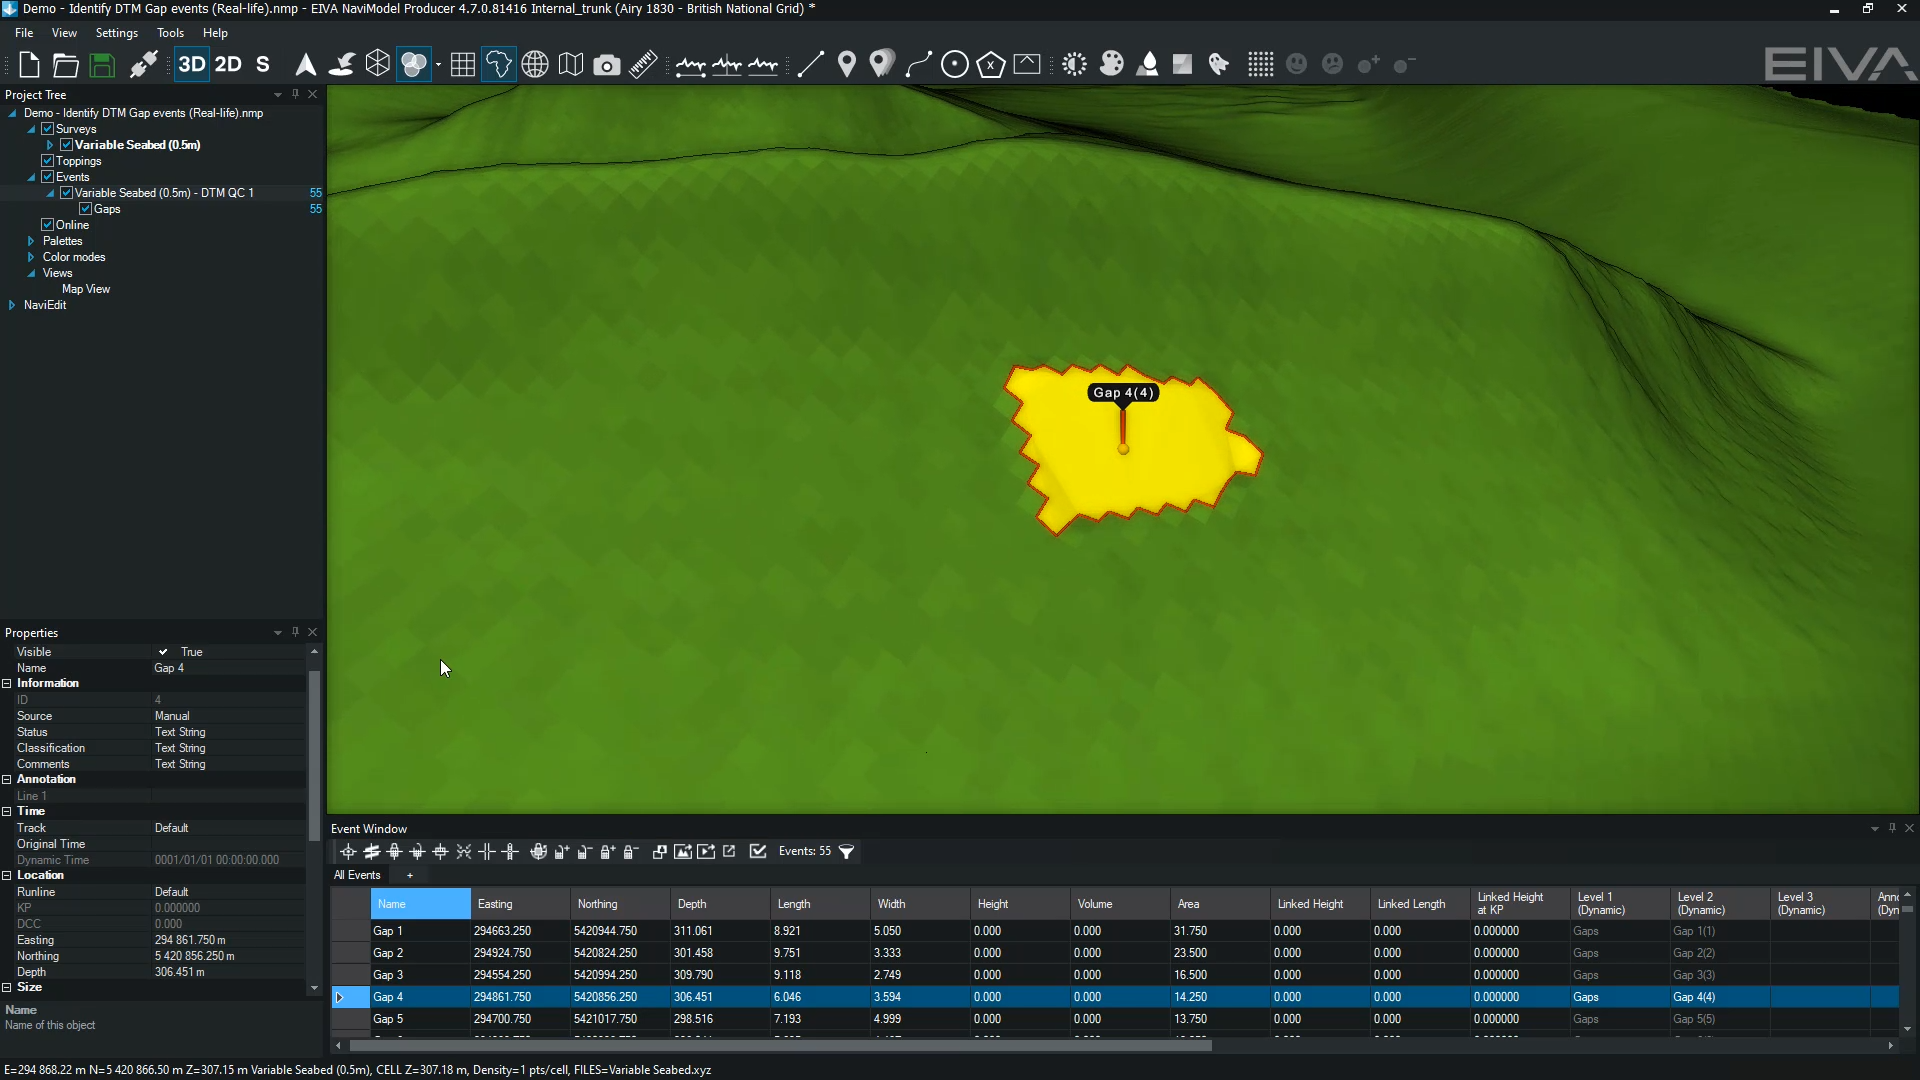
Automatic gap detection
This tool analyses DTMs to identify areas which have no coverage (i.e. contain gaps).
Matchup
Matchup tool can be used to correct for DTM artefacts caused by incorrect ROV XYZ position.
Points are moved based upon differences between two existing lines (source and destination).
Points are moved perpendicular to the destination line.
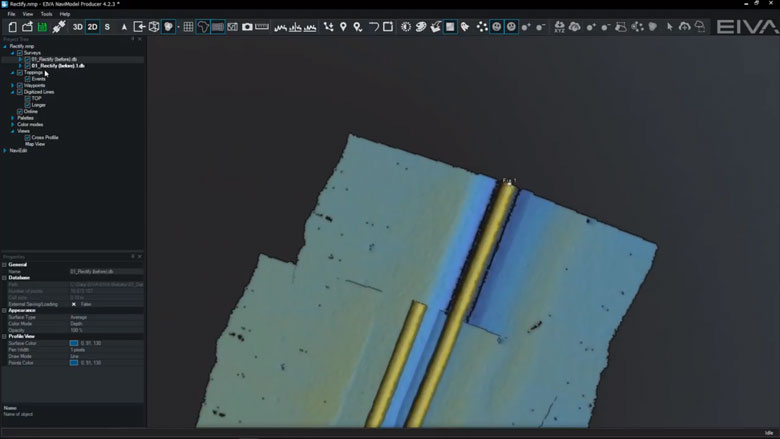
Rectify
Rectify tool can be used to correct for DTM artefacts caused by incorrect ROV XYZ position.
Points are moved based upon differences between two existing lines (source and destination).
Points are moved perpendicular and along length to the destination line.
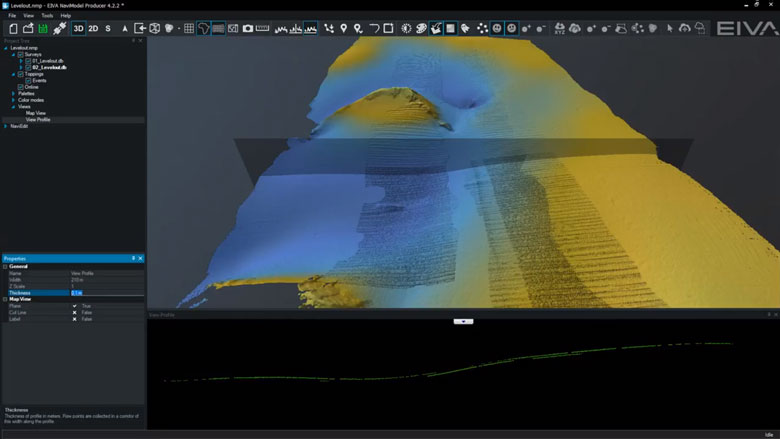
Level out
Level out tool can be used to correct for small depth differences between surveys.
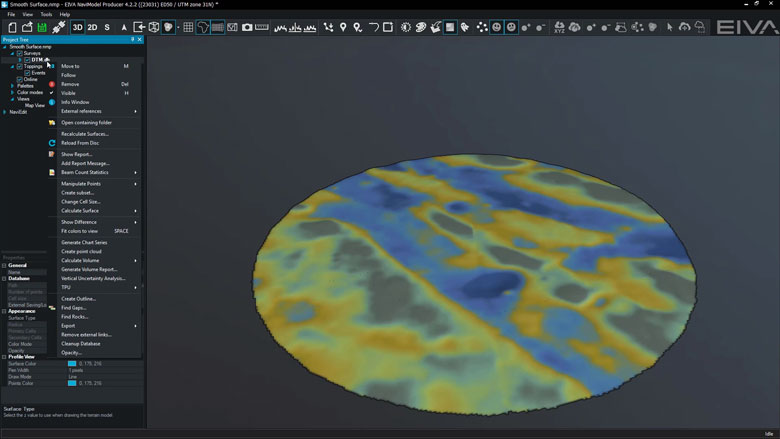
Smooth surface
Smooth surface tool smooths a DTM surface by an absolute distance or by the number of DTM cells.
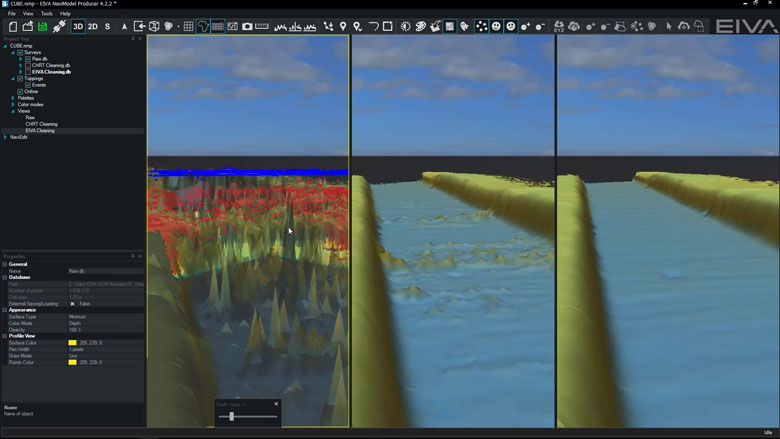
CUBE
Combined Uncertainty and Bathymetric Estimator (CUBE) tool is available in NaviModel and is implemented alongside our other cleaning approaches.
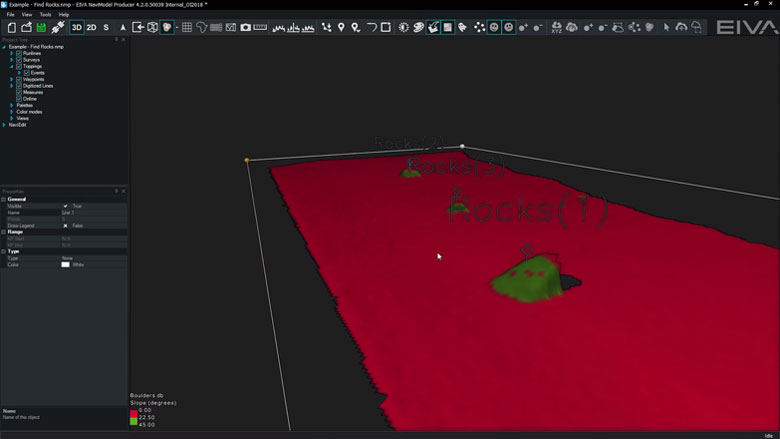
Find Rocks
This tool analyses DTMs to identify rock events.
-
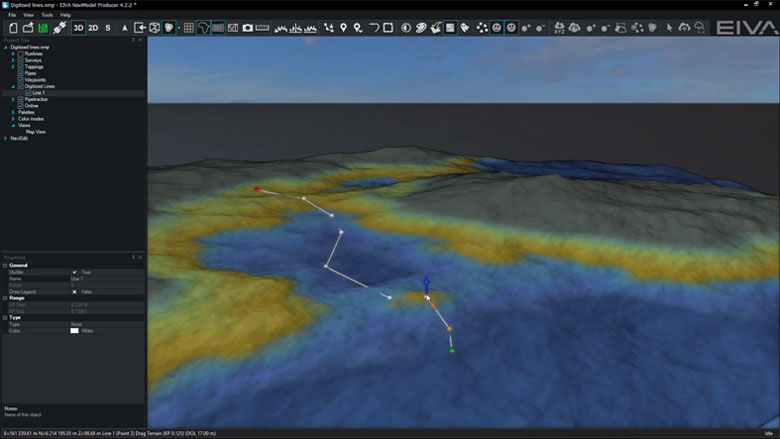
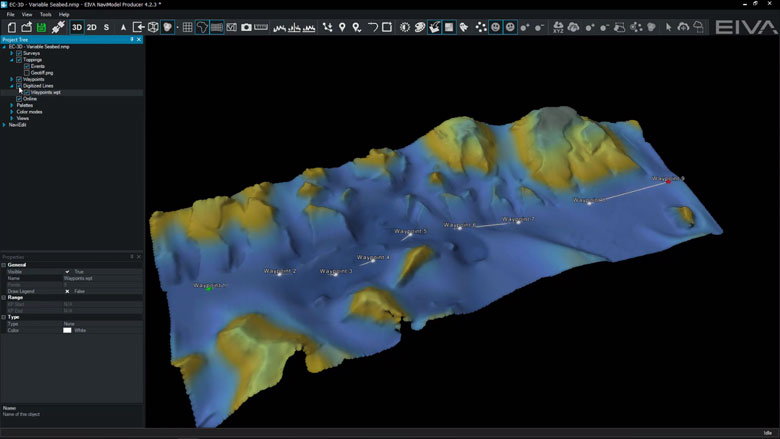
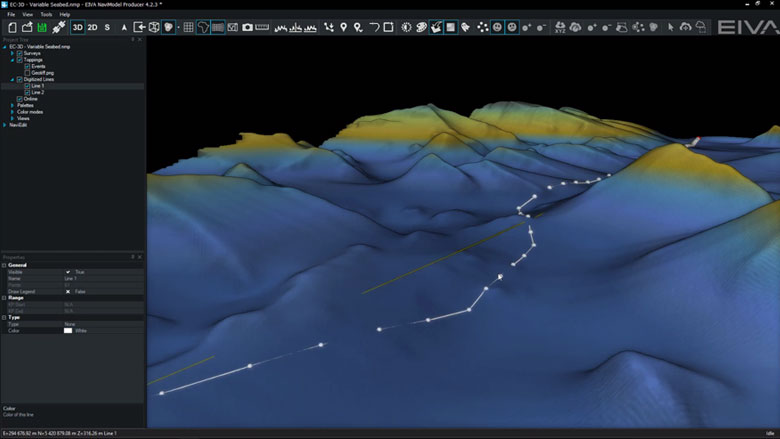
Line and track tools
We have a large range of tools to create, modify, graph and export lines that are digitised within NaviModel. Digitised lines are multipurpose and are used both online and offline. Some examples of digitised line usage include controlling pipelines and seabed marker positions, creating boundaries, engineering designs and runlines.
Line and track tool features
We have a large range of tools to create, modify, graph and export lines that are digitised within NaviModel. Digitised lines are multipurpose and are used both online and offline.
Modify lines
Lines can be modified in many different ways.
Line smooth
If required, the entire length of the line can be smoothed in XYZ.
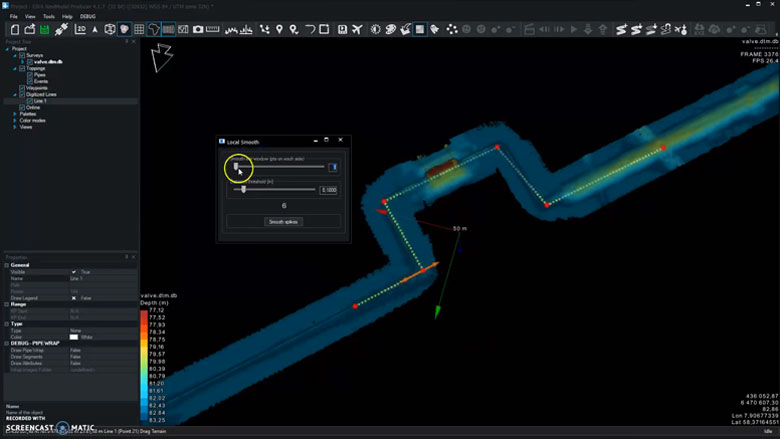
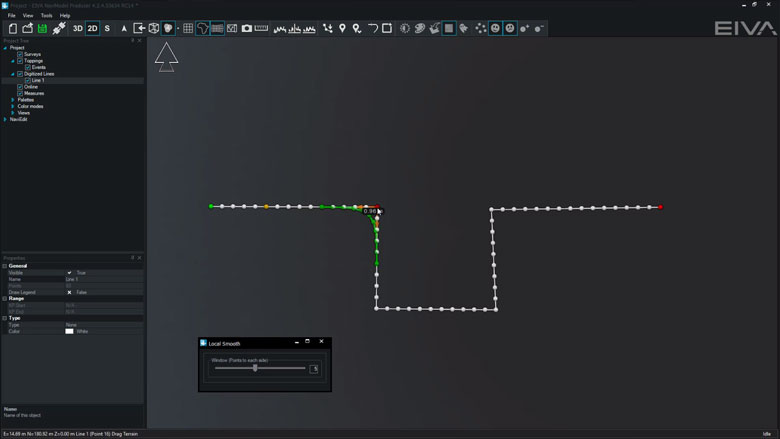
Local smooth
Local smooth tool allows you to concentrate on small line sections that require remedial action.
Convert waypoints to lines
Waypoints can be converted to lines via the ASCii Importer.
Compare lines
Whilst we can always compare lines visually in the Map View window, sometimes it is better to create graphs for comparison.
-
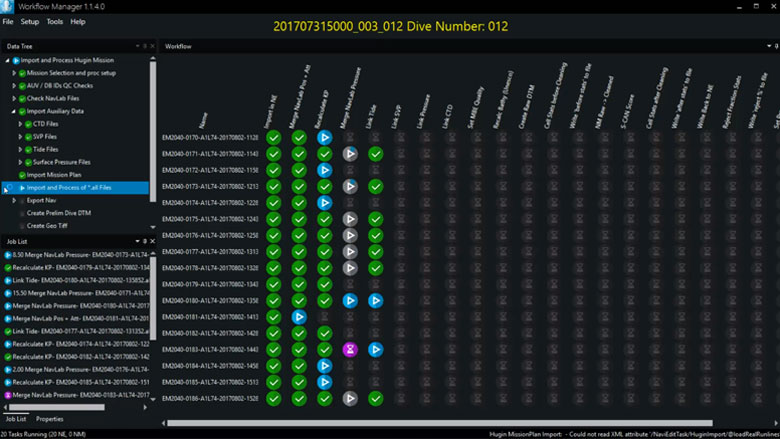
Automatic data processing tool
Save time on data processing by automating your workflow – using NaviSuite Workflow Manager, designed to enable a previously unseen degree of automatic data processing of massive amounts of subsea sensor data.
Automatic processing features
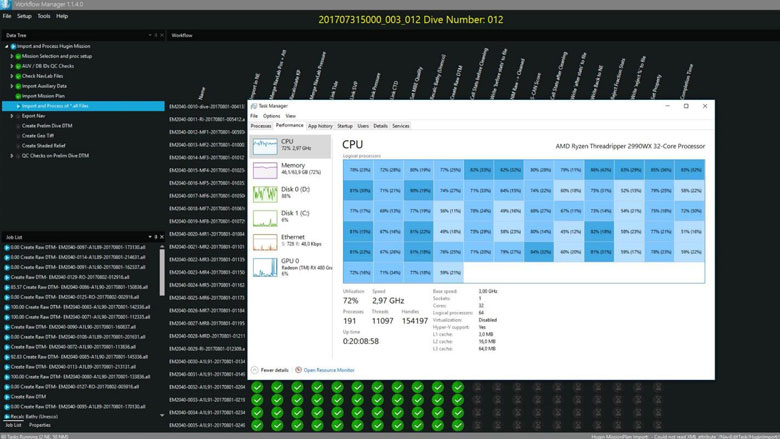
The NaviSuite Workflow Manager tool is designed to enable a previously unseen degree of automatic data processing of massive amounts of subsea sensor data.
AUV processing workflow
The first version of the Workflow Manager utilises NaviEdit and NaviModel for a traditional survey data set processing of data from AUV dive. As soon as the data is available, it is automatically loaded into the flow and processed by cleaning data, merging reprocessed AUV track, building DTMs and making sanity checks. This is typically done using the Server version.
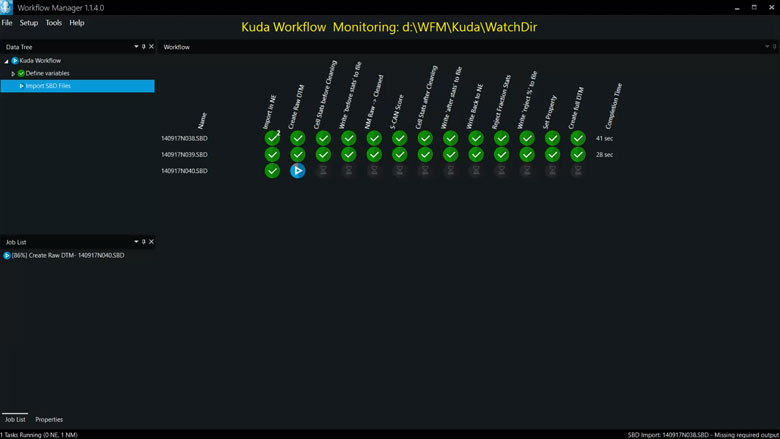
NaviSuite Kuda processing workflow
The Workflow Manager desktop version is very well suited for NaviSuite Kuda operations where each file will be processed right after recording, thus enabling reporting and quality control as you go. The Desktop version runs one task at the time – but it is more than fast enough to cope with survey speed.
Execute multiple parallel NaviEdit, NaviModel and 3rd party commands
The more CPU (cores), memory and disk speed you have – the better you utilise the workflow engine. The optimal solution is running a bit fewer processes than the number of cores.
-
Eventing
The many eventing features include auto-calculation of event types and an easy-to-use event tablet view.
Eventing features
The many eventing features include auto-calculation of event types and an easy-to-use event tablet view.
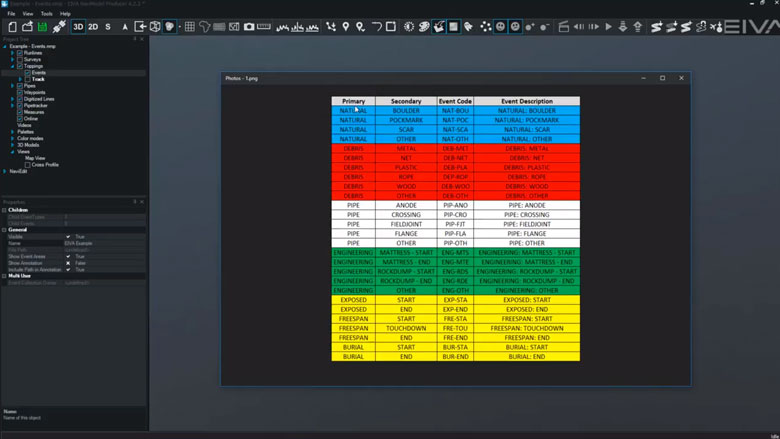
Configurable event types, hierarchy, and properties
Client and company specific event collections can be tailored to the activity undertaken.
During EIVA Days Denmark 2018, we presented a major expansion to the functionality of camera based scanning.
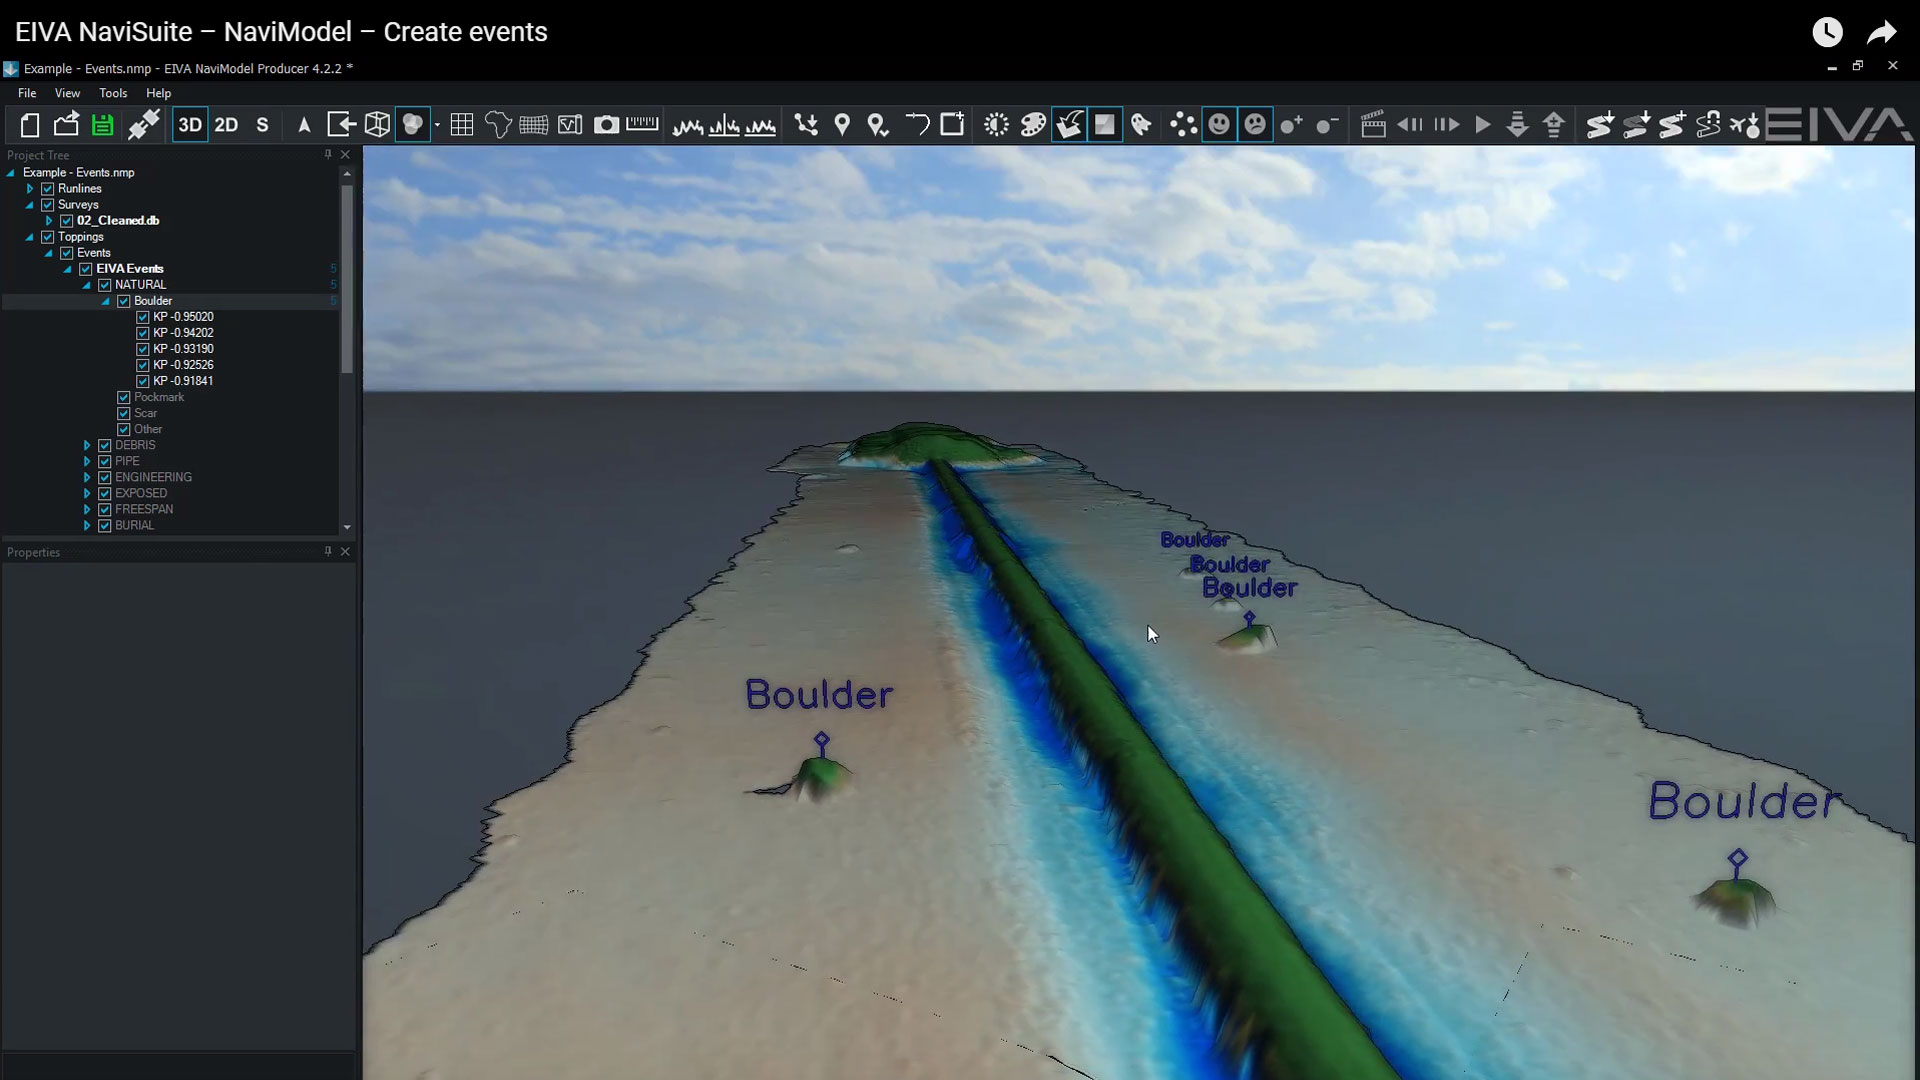
Create events
Events can be created quickly and are automatically placed onto a DTM.
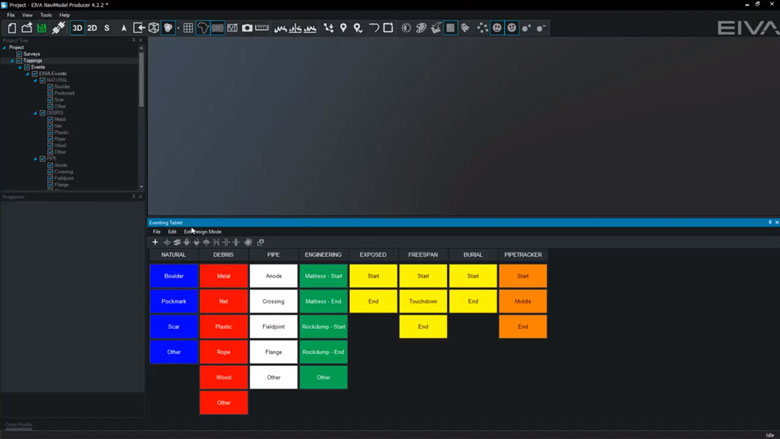
Tablet for fast event creation
Using the eventing tablet view allows for quicker event creation. With the eventing tablet, you can quickly add all events, or customise which events to add with just a few steps.
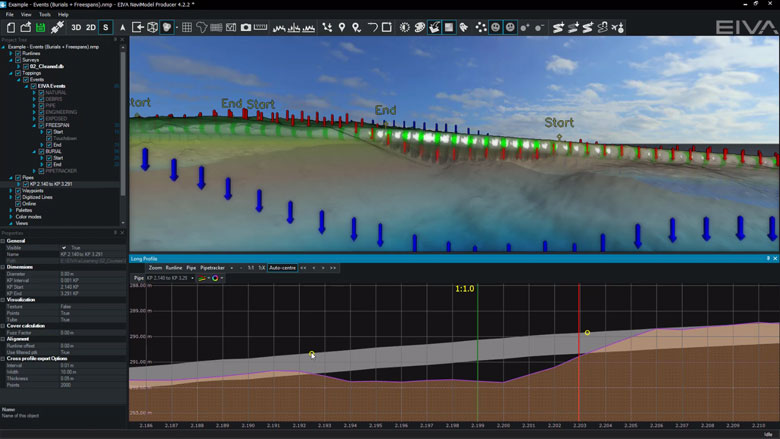
Create freespan and burial events
Pipe and seabed markers are used to create freespan and burial events.
This means that events and seabed markers always tie-in.
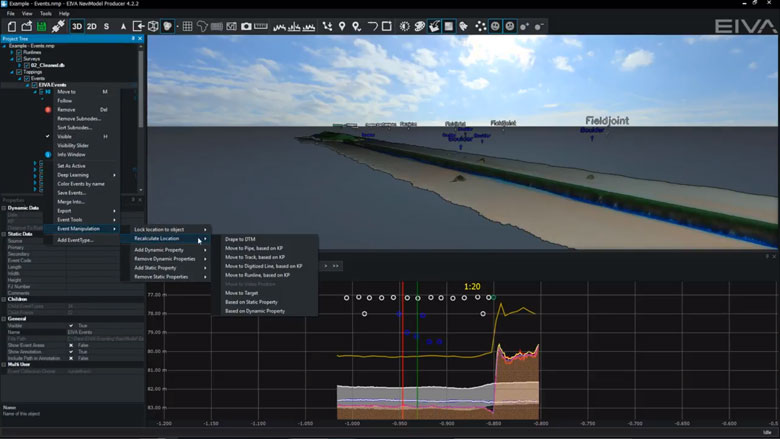
Recalculate events
Events can be recalculated at any time.
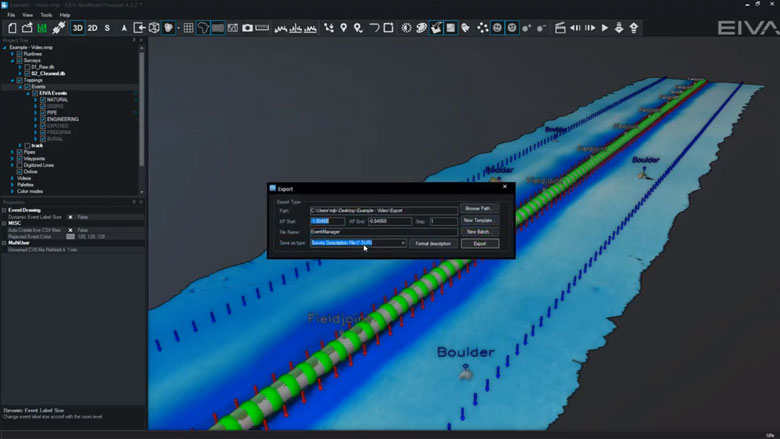
Export events
User configurable templates can be created to export events in the format required.
Export nearest image and videos
Images and videos can be exported for each event or for selected events.
Create pipetracker gap events
Pipetracker gap events are created from continuous sections of rejected pipetracker data.
You can also automatically identify and generate DTM gap events for quality control.
-
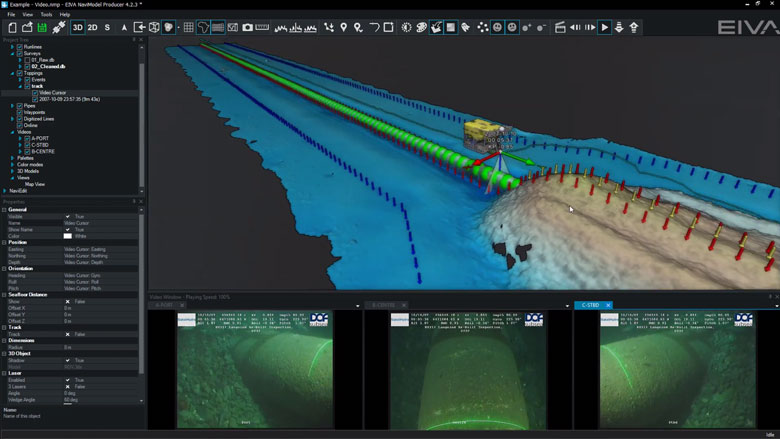
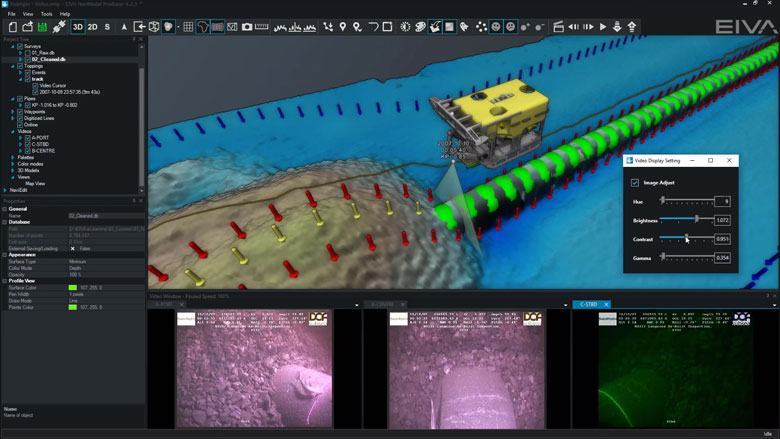
Videos and image display tools
Combine data sources in the intuitive interface of NaviModel, including videos and still images that contain time stamps.
Videos and images features
Video and still images that contain time stamps can be combined with other data sources in NaviModel.
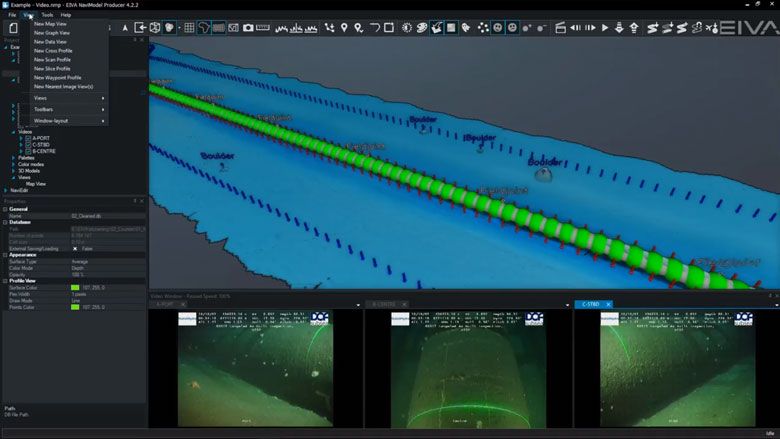
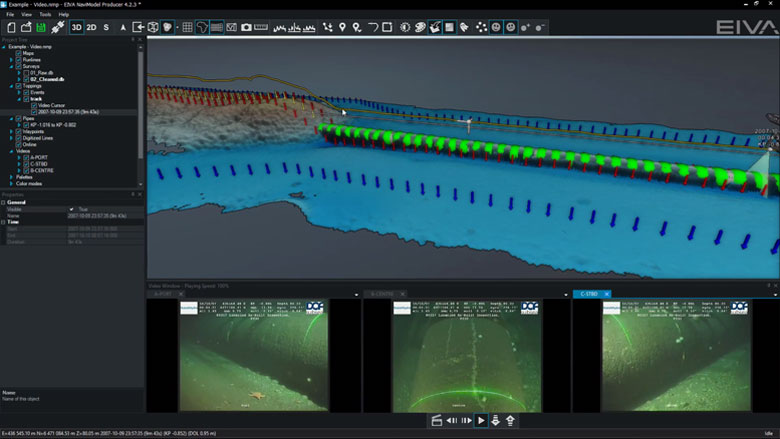
Play and control video
Digital video acquired in external systems can be played and controlled inside NaviModel.
Synchronise video with track
In NaviModel the track contains the date and time and must be synchronised with the video time to enable videos to play.
Normally the video time and track time are recorded in the same time zone. However sometimes this is not the case and we need the option to change the video / track time so that video will play.
Adjust video hue, brightness, contrast and gamma levels
Hue, brightness, contrast and gamma levels can be adjusted to improve badly lit videos.
Related products
-
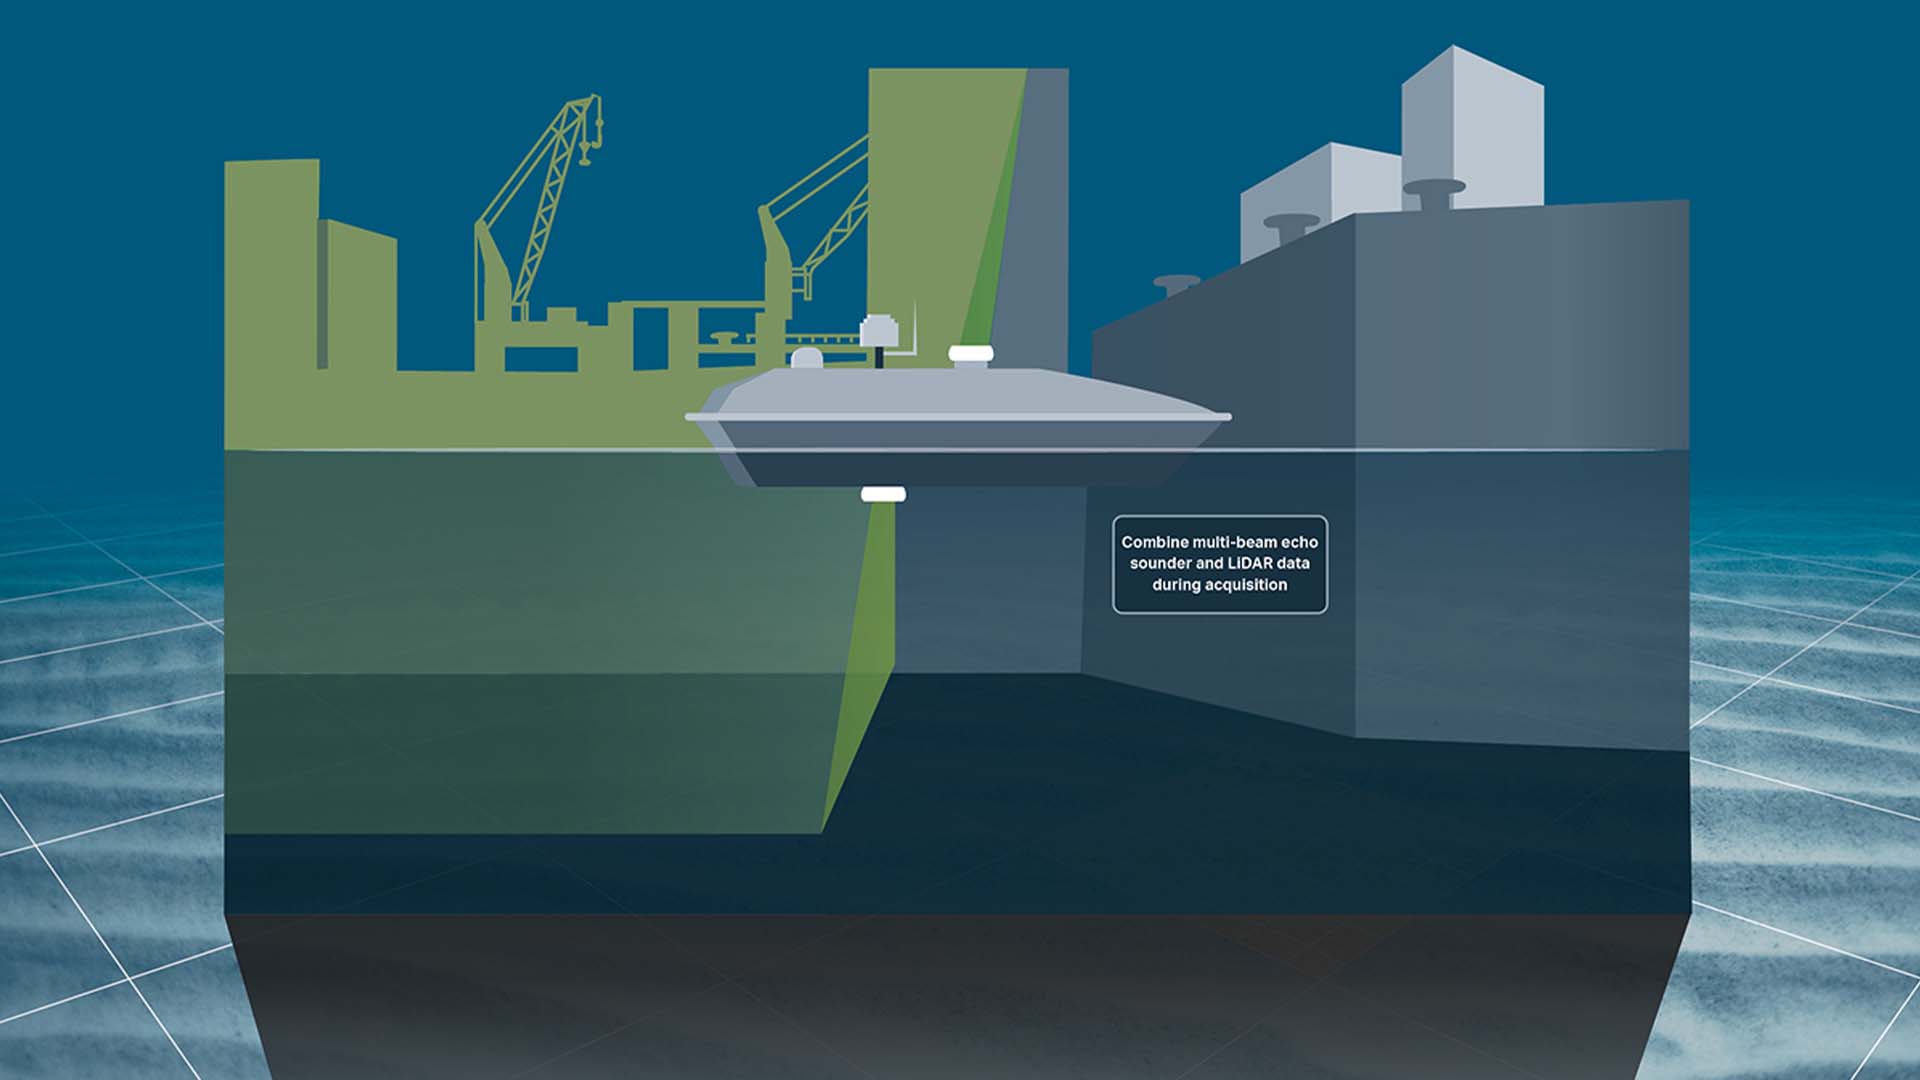
NaviSuite Kuda Core
Unmatched software with deep feature list for shallow water data acquisition – Entry-level variant – Supports multi-beam echo sounders, lasers and cameras.
€ 42.00/day€ 2,600.00/year€ 7,800.00/permanent -
NaviSuite Kuda Core + Processing
Unmatched software with deep feature list for shallow water data acquisition and processing – Entry-level variant – Supports multi-beam echo sounders, lasers and cameras.
€ 74.00/day€ 4,550.00/year€ 13,650.00/permanent -
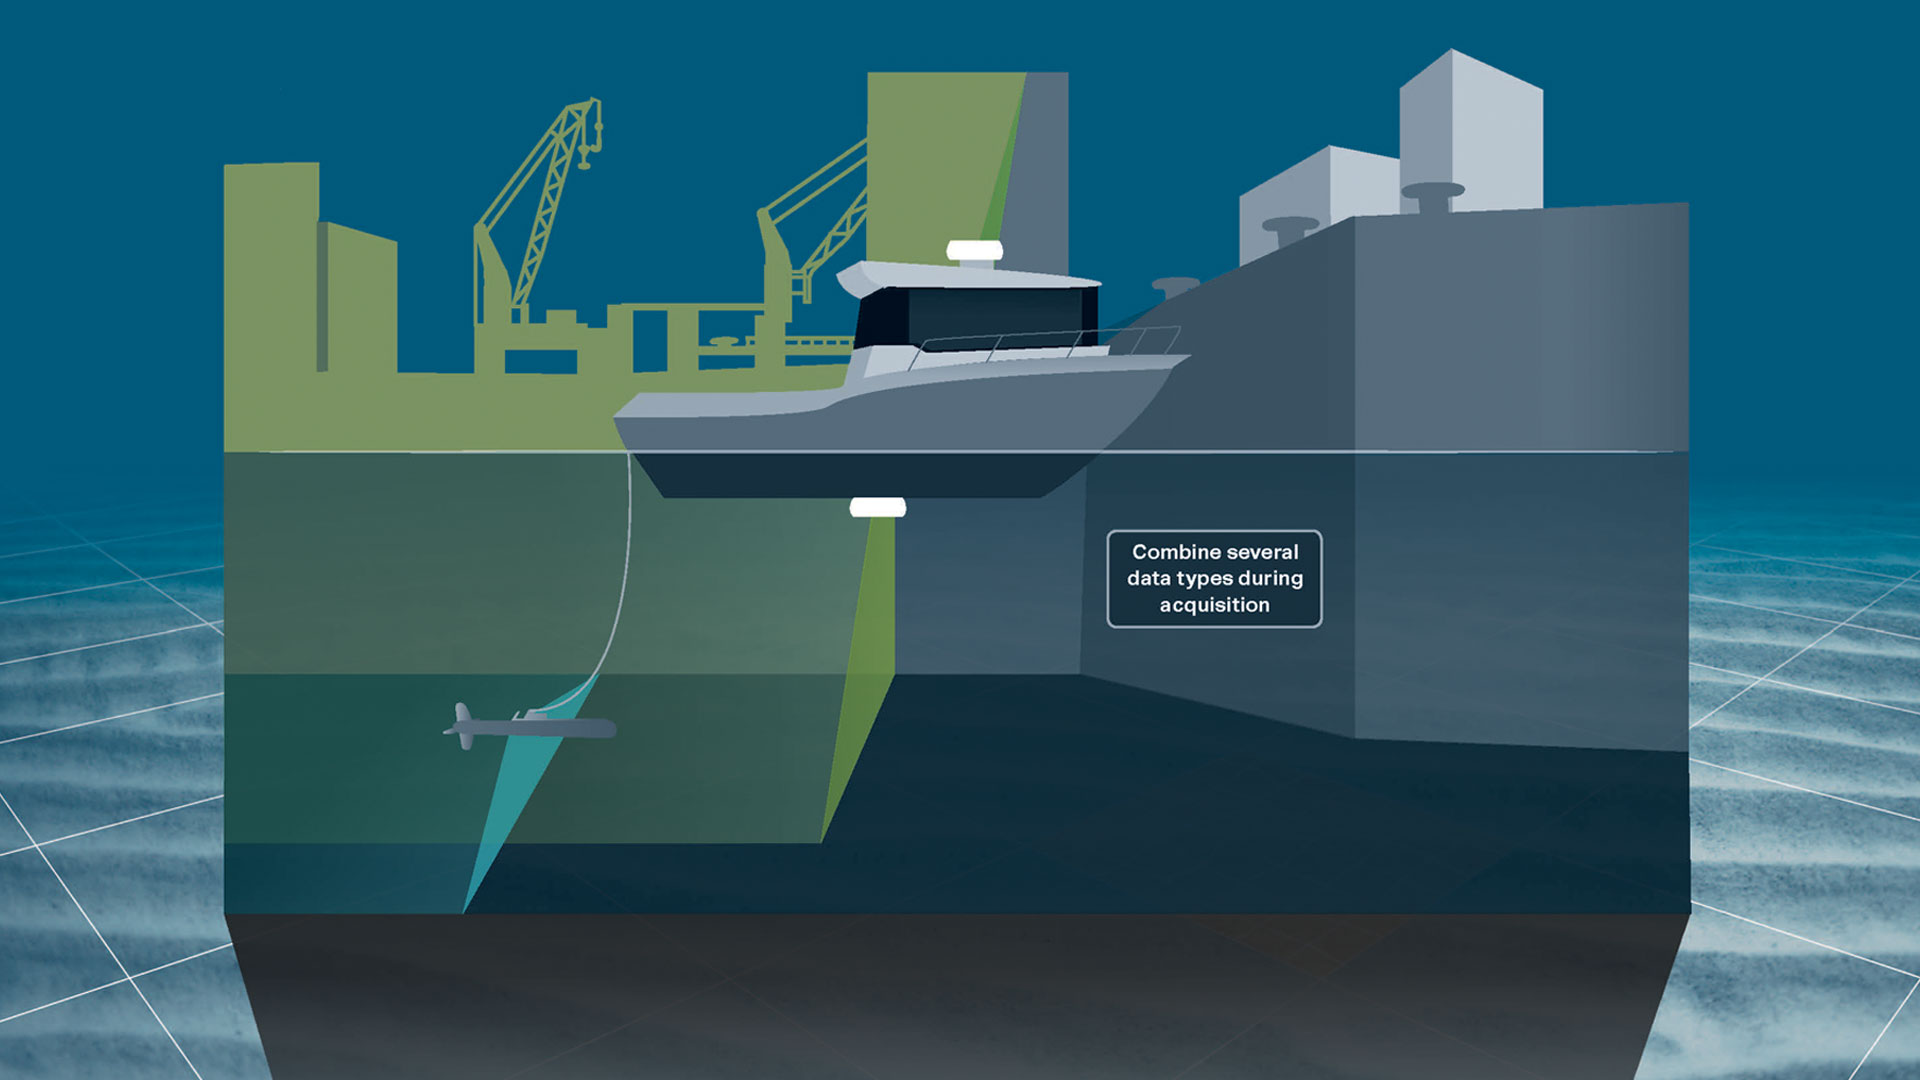
NaviSuite Kuda Pro
Unmatched software with deep feature list for shallow water data acquisition – Supports all relevant instruments – Unlimited remote displays – Tracking of a subsea object.
€ 84.00/day€ 5,200.00/year€ 15,600.00/permanent -
NaviSuite Kuda Pro + Processing
Unmatched software with deep feature list for shallow water data acquisition & processing – Supports all relevant instruments – Unlimited remote displays – Tracking of a subsea object.
€ 155.00/day€ 9,542.00/year€ 28,625.00/permanent