To use this site, please enable javascript
To use this site, please enable javascript
The technological development of the maritime industry is moving faster than ever. Staying ahead and thus ensuring maximum gain of the possibilities it brings, from the beginning, is vital to every organisation involved in operations at sea.
EIVA sees five decisive trends resulting from new and improved technologies. In this and four additional blog items, our CEO, Jeppe Nielsen, will dive into each of these trends in detail.
Author: EIVA CEO Jeppe Nielsen
EIVA was born out of the offshore construction sector in 1978. Through the years, we have expanded our activities and products to cover numerous other sectors of the maritime industry. The nearly 40 years in the business have taught us that the technologies behind the equipment and software in play are intertwined, and that there is an evident synergy of applying these across the numerous sectors evolving around subsea and above water survey and engineering. This includes new trends and the possibilities they bring.
One such trend is the use of 3D and even 4D visualisations throughout the data workflow of survey and engineering operations, from acquisition, quality control and cleaning all the way to processing and creating deliveries. Here, the fourth dimension refers to time, and thus means the possibility of working with data in real time and of comparing data over time. Or, in other words, analysing the development seen in different data sets from surveys made at different points in time.
One example of how 3D technology brings new possibilities to survey and engineering professionals is working with 3D data during pipeline inspection jobs.
Traditionally, these jobs have relied on data provided in 2D by video, graphs and cross profiles. With 3D now literally in the picture, a much more extensive data visualisation ensures that data can be reviewed and analysed much faster and in more detail.
The screenshot below shows a setup in NaviPac 4 (the EIVA NaviSuite product for navigation and vessel/subsea object positioning) during a pipeline inspection survey. A single display integrates multi-beam echo sounder, video and ROV data, thereby combining 2D and 3D data for maximum synergy.
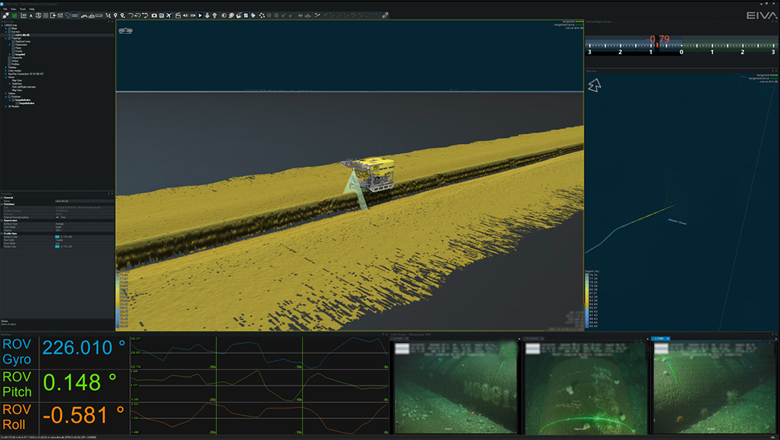
Setup in NaviPac 4 during pipeline inspection job
When comparing different ways of presenting data and deliveries / end-reports, it also becomes clear how powerful 3D visualisation is.
The reason is obvious; 2D does not offer the best presentation of spatial information. This is illustrated below: with a 2D view to the left and a 3D view to the right, one can see how 3D provides a much more elaborate view.
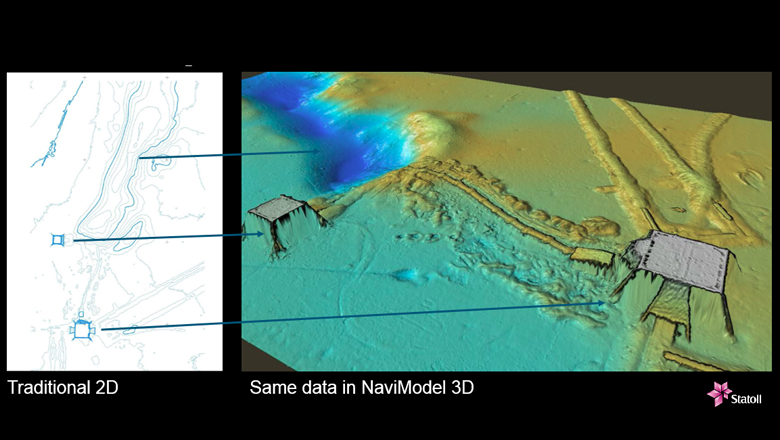
Comparison of 2D and 3D subsea data
Also, traditional 2D profile views will not show sideway bucklings, only vertical bucklings – whereas both types are easy to detect in the 3D view.
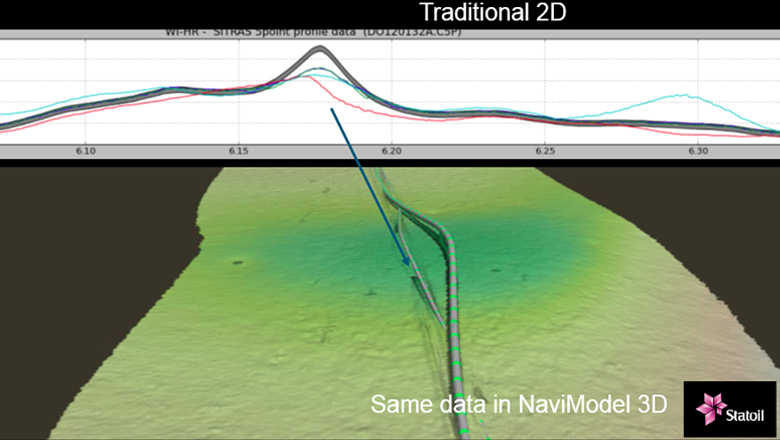
Difference between 2D and 3D views of bucklings
As for an example of data presented in 4D, scour monitoring is an obvious application for this feature. Although, in this regard, a data set only becomes valuable when there are other data to compare it to. As shown in this video, a simple 4D slider offers an instant understanding of the development of scour around the base of a wind turbine.
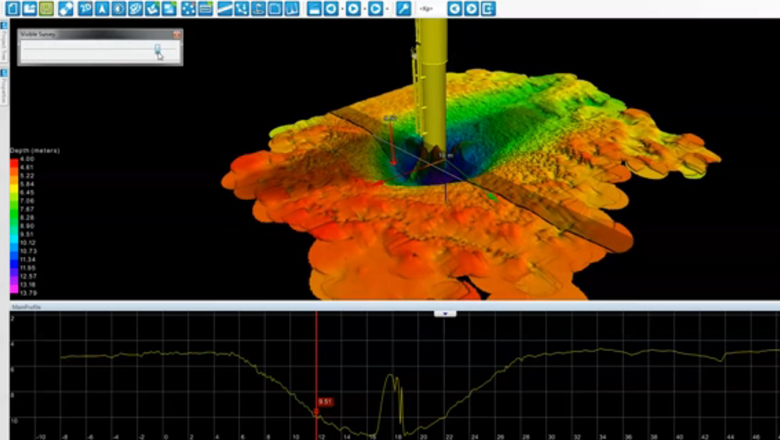
EIVA NaviSuite - Comparing 3D models
Often, survey and engineering professionals need to create an overview of a site, such as an oil field, that brings together various types of 3D data. As an example, BP integrates 3D AutoCAD drawings of structures into a 3D digital terrain model when analysing jack-up leg position options. Again, the key purpose is to create a visual presentation of the data in order to facilitate decision-making and to streamline the operation workflow.
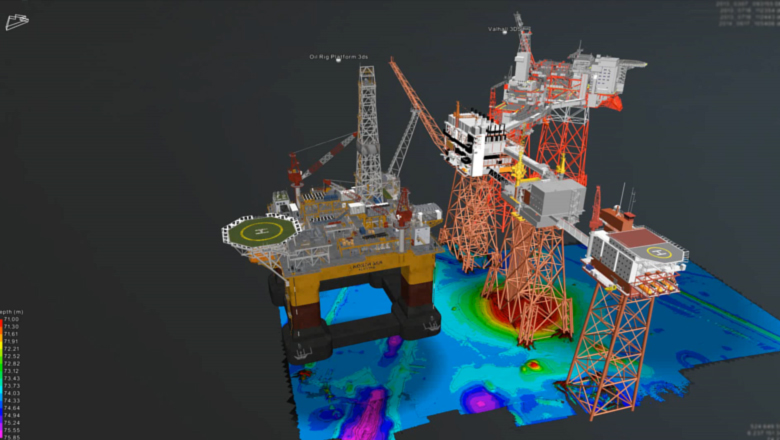
AutoCAD and 3D digital terrain model of the seabed combined in NaviModel
You can also hardly talk about 3D technology without mentioning virtual reality. This technology is increasingly gaining ground in many different industries, driven by the gaming industry. Within recent years, it has come much closer to a useful application in the maritime world, and what we see at this point is just the beginning.
We started to look into the possibilities of using Oculus Rift virtual reality headsets with our NaviSuite software about a year ago. What was first a gimmick quickly proved to hold real potential. There is no doubt that there are valuable applications and possibilities for this. Some examples might be use of the technology for ROV pilots, 3D subsea navigation in general etc.
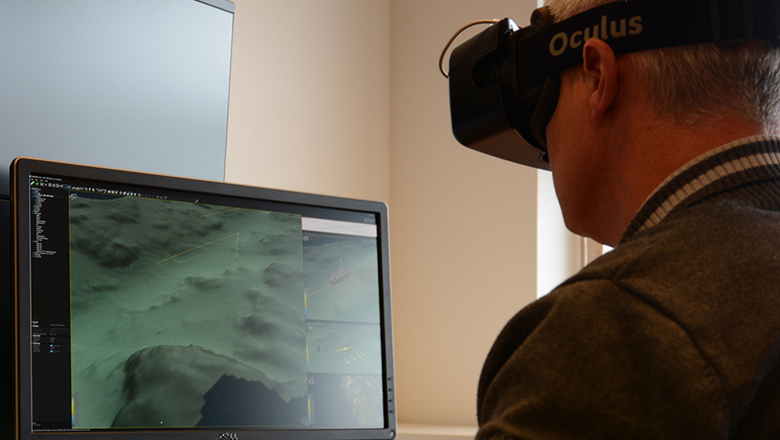
Use of virtual reality with subsea sensor data sets has proved to hold real potential