To use this site, please enable javascript
To use this site, please enable javascript
Author: EIVA CEO Jeppe Nielsen
Variation in specifications and performance of computers of course means that the choice of hardware can make a difference to the efficiency of your workflow.
We decided to look into just how much a difference this is via the performance statistics gathered within the NaviSuite software product for data modelling and visualisation, NaviModel. The statistics proved to hold valuable information, and the answer is: a huge difference
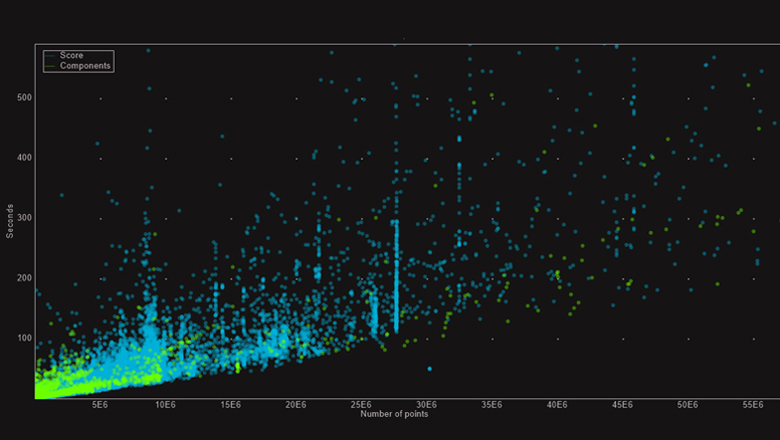
Scatter plot showing S-CAN computation time (in seconds) versus size of data being processed (in points) where each plot is a single run of S-CAN
When we released NaviModel 4.1, it came with an improved, much faster S-CAN algorithm. S-CAN is an advanced tool for automatic point cloud cleaning, developed in collaboration with the Center for Massive Data Algorithmics (MADALGO) at Aarhus University in Denmark.
This posed the perfect opportunity to dive into the effect computer specifications (especially in terms of RAM and disc size) have on the efficiency of software tools.
The above data was gathered from our own tests as well as those customers who have given consent to us using the data, during a period of 8 months. It covers more than 40,000 runs of S-CAN, and numerous different computers, covering the entire scale of specifications from poor to high performance.
When analysing the data, it becomes clear that:
If you run S-CAN on a data set with for example 10 million points and measure the processing time, you can see from the graph how other machines are performing. If your results come in closer to the 600 seconds than 25, it is an indication that it may be worth your while buying a faster machine.