How NaviSuite Kuda created fast, visual and deliverable data from a harbour inspection
The challenges involved during harbour inspections
At the Port of Moss, harbour inspections, which includes undertaking hydrographic surveys, serve several purposes: maintenance and monitoring of quayside structures, monitoring the depth of the seabed and any channels, and locating objects on the seabed that shouldn’t be there.
The Port of Moss is located in the middle of the Oslo Fjord, Norway. It has a total quay length of 670 meters and is up to 11 meters deep in places. The ferry connection between Moss and Horten is Norway’s busiest national road connection at sea, and the harbour is one of the country’s largest container ports, which makes the Port of Moss an important part of the supply chain. With a high degree of traffic, and with the harbour’s desire for efficient service and focus on the environment, the maintenance and continual operation of the port is essential.
Styvehavn and the Port of Moss talk about how they use NaviSuite Kuda for harbour inspections – video courtesy of the Port of Moss
The Port of Moss hired Styvehavn AS to conduct a harbour inspection. Styvehavn is a maritime engineering company that specialises in two main areas of service, one being seabed mapping and inspection. Collecting high-quality data requires optimal conditions during the data acquisition, however, at Moss harbour, Styvehavn faced several challenges due to the shifting environment: grazing angles, ping rate, and beam footprint – which is single point on the seabed. All these factors and more need to be considered during a survey, as the depth of the water and how the multi-beam echo sounder is set up affect the end result.
One specific challenge faced by Styvehavn was keeping track of sound velocity changes. A canal connects two basins at Moss harbour, which both have different temperatures, salinity, and tides, as the water moves in and out of them. In addition, the Port of Moss has frequent visits from large ferries which disturb the water column in parts of the harbour.
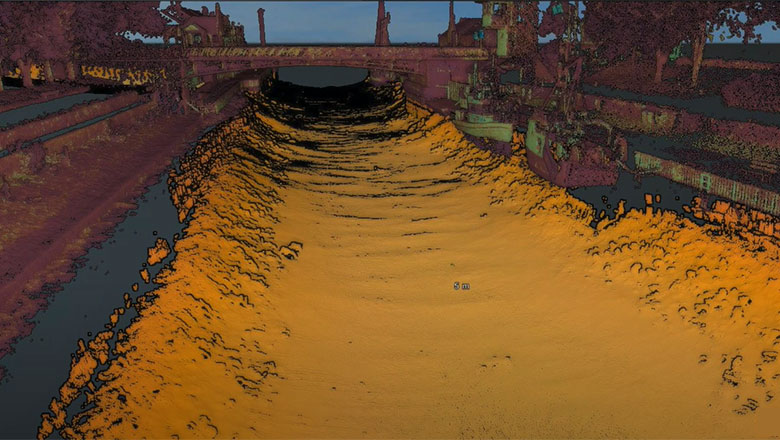
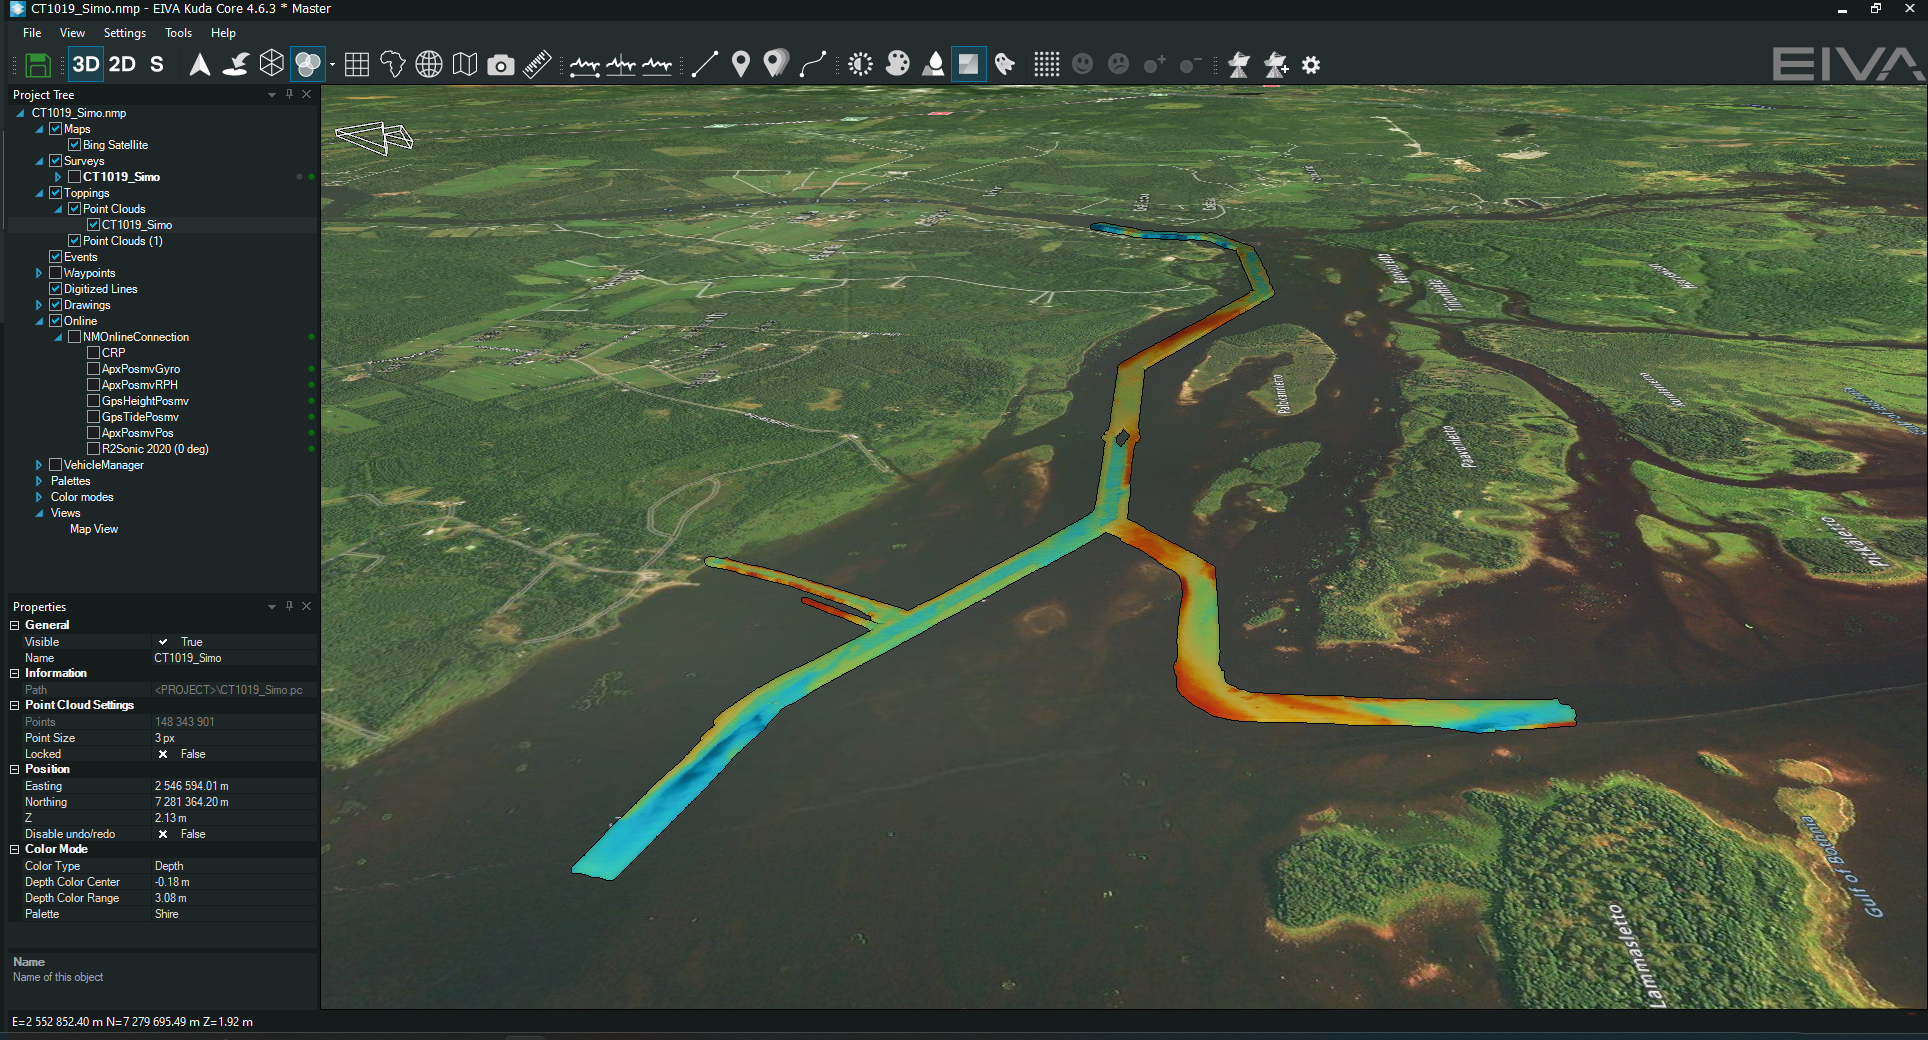
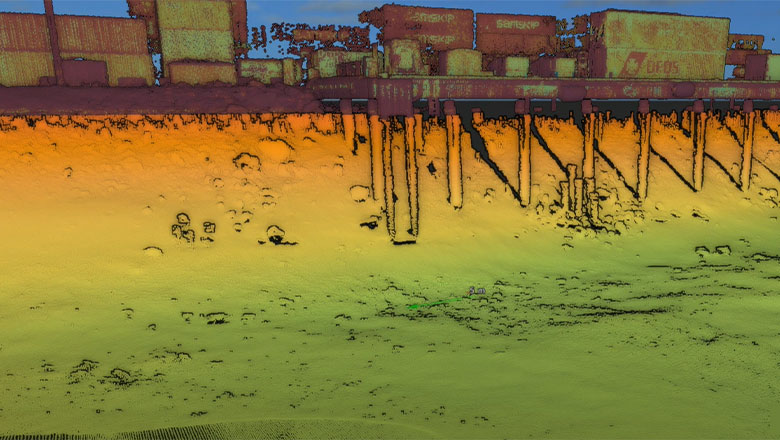
Hydrographic data from a harbour inspection survey visualised with 3D software
A clean software solution
Styvehavn utilised the Norbit iWBMSh multi-beam echo sounder system for the harbour inspection. Due to the curved array of the sonar, it enables the collection of high-quality raw data with over 90 degrees beam angle, and also allows for sufficient soundings for vertical terrain and structures. Laser data was collected simultaneously above water with a Velodyne LiDAR (VLP-16).
Styvehavn used NaviSuite Kuda for the acquisition and processing of the hydrographic data. The software bundle includes features such as remote tidal correction, accurate sensor time tagging and efficient data cleaning, that directly assisted Styvehavn to collect and clean the multi-beam echo sounder and LiDAR data, which was then made deliverable to the end client.
The processing and editing features minimised time spent post-processing and improved the quality and precision of the survey results. Furthermore, real-time processing made it possible to create a real-time DTM (Digital Terrain Model) which gave Styvehavn an overview during the collection of the data.
The cleaned results
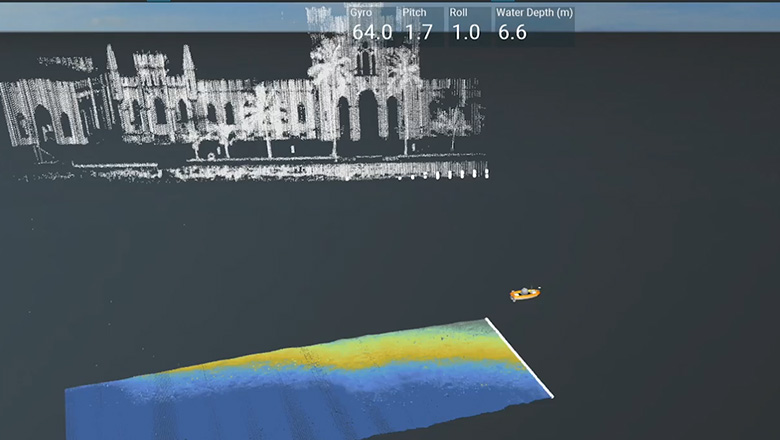
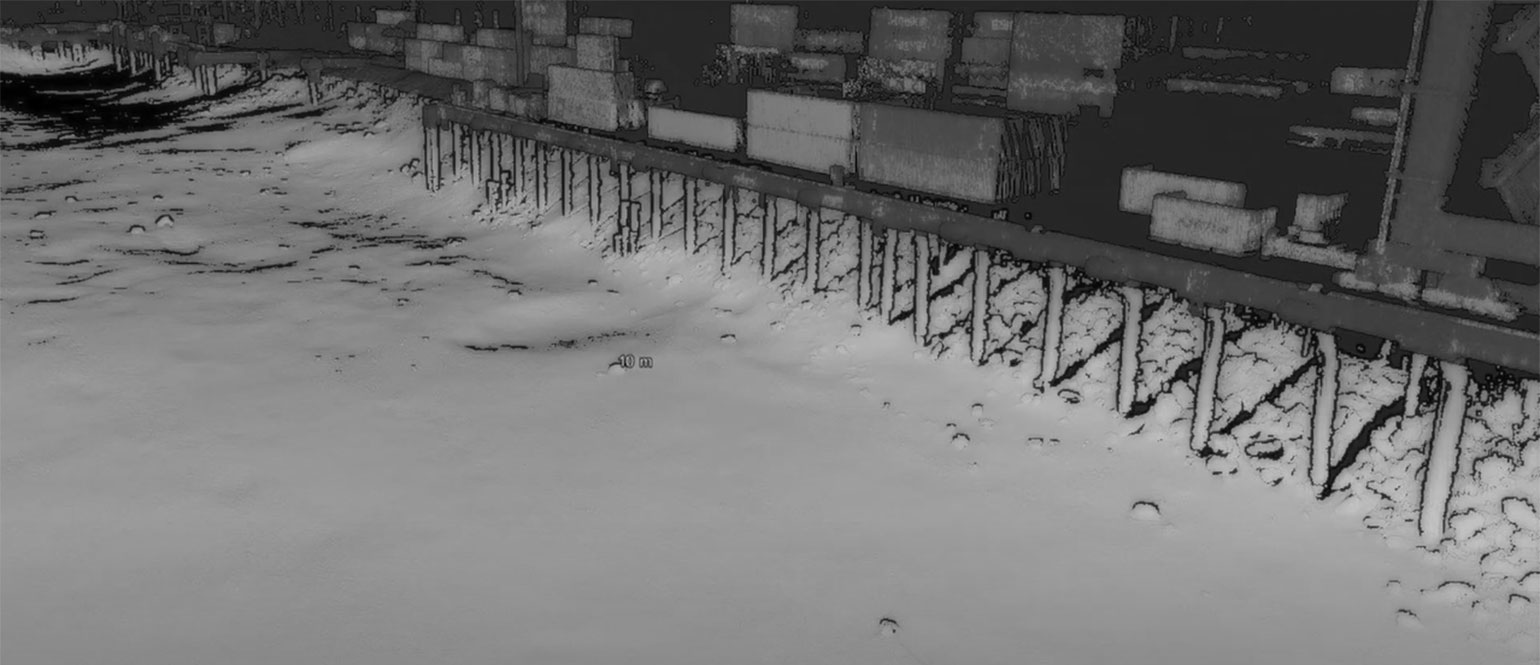
When merging the data from the multi-beam below the surface of the water, and the laser scanner data from above, NaviSuite Kuda generated a complete 3D model in NaviModel, with both DTM (gridded model) and point clouds. This gives Styvehavn and the Port of Moss a high-quality visualisation of the harbour.
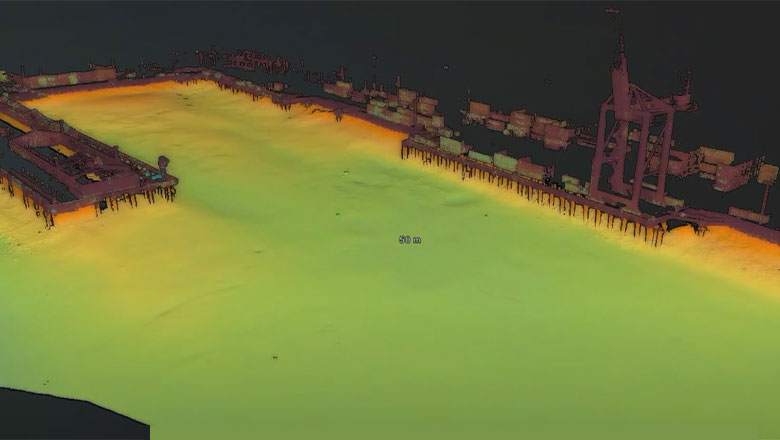
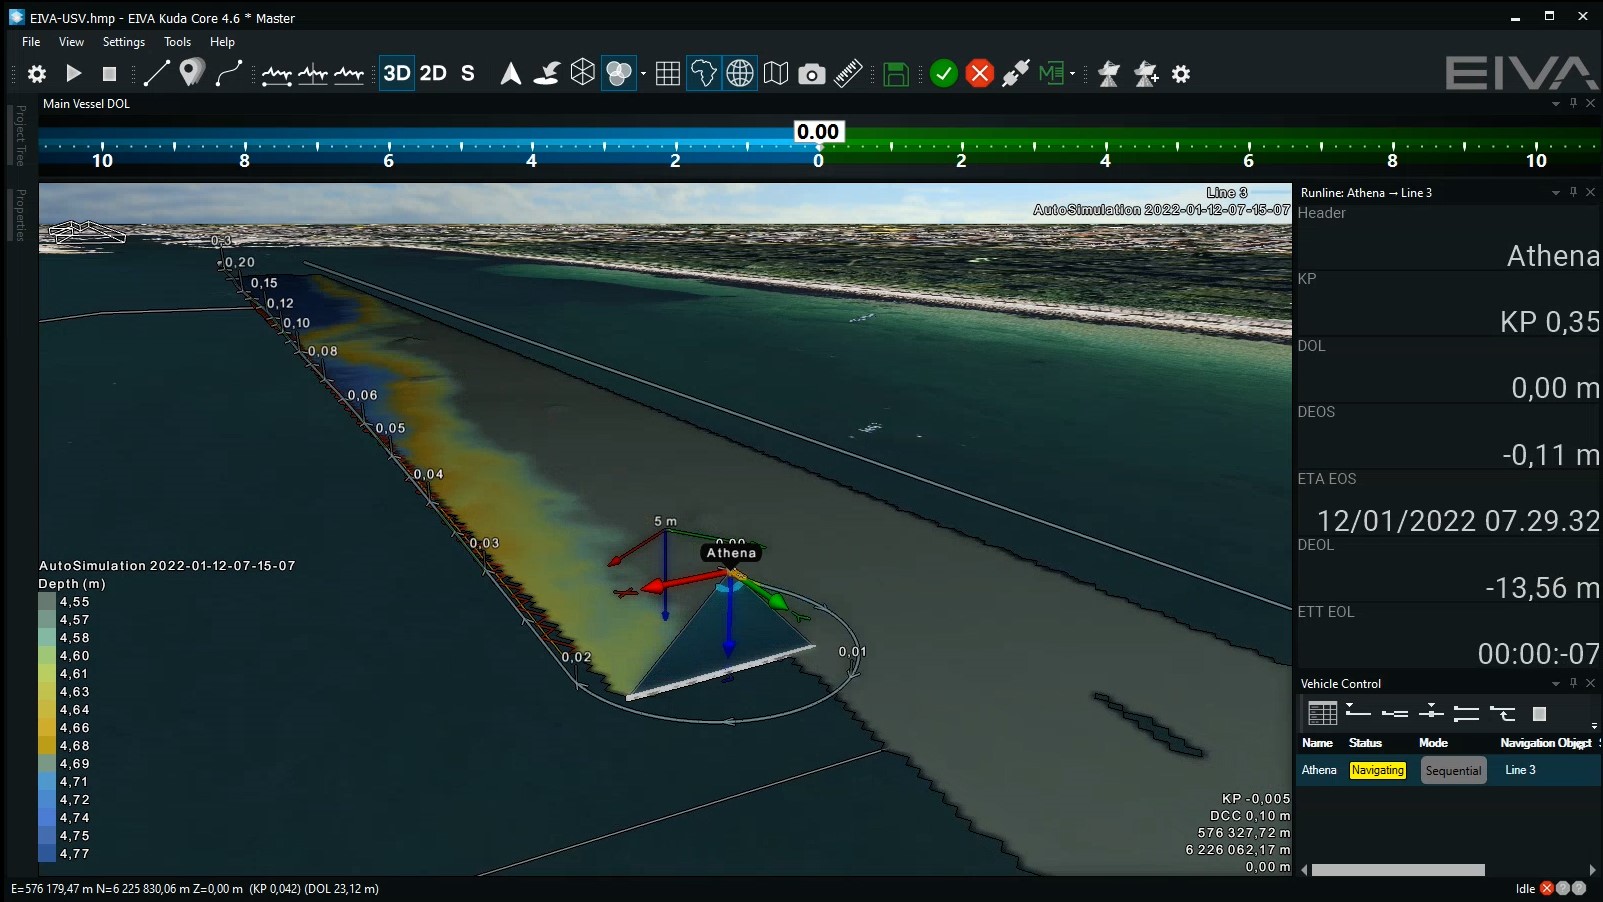
Hydrographic survey data of a harbour inspection delivered to and viewed by an end client in NaviModel Free Viewer
The inspection data was made deliverable to the end client through NaviModel Free Viewer, which is free to download. From there, the Port of Moss are able to visual, evaluate, and plan any future maintenance required.
A typical hydrographic survey with NaviSuite Kuda can be done in as little as a few hours with the data prepared and deliverable as soon as the next day. During this operation, Styvehavn completed the survey in 6 hours, with the data post-processed and available for delivery to the Port of Moss shortly after. This kind of data is more challenging and time consuming to process than a typical hydrographic survey as more effort must be made to keep vertical walls, features and objects within the datasets, while at the same time clean of any noise. NaviSuite Kuda provided Styvehavn all of the tools to achieve this.
Products in play
Facts and figures
- The ferry connection between Moss and Horten is Norway’s busiest national road connection at sea
- The quay length at Moss harbour is 670 metres
- The depth of the harbour is 11 metres in places
- Styvehavn completed the survey in 6 hours